This is the “worst” financial quarter we’ve posted in the last year, but for being the “worst” it’s still pretty good 😉 If you would have told us a couple of years ago that we would be calling this a “bad” quarter, we wouldn’t have believed you. However, it hasn’t always been this way. If this is your first time ever reading one of our income and expense reports, I suggest starting with the first one we ever published in July of 2016 (our total income was $603.26)
Now that we’re making what feels like a crazy amount of money from this business, I feel like it’s important to tell you why we started writing these reports in the first place – and why I am continuing to write them (at least until we hit our goal of 100 countries).
When we first made these reports in our 6th month of full-time travel, the goal was to make enough money to cover our travel expenses so we could continue traveling. The purpose was to document that journey. We thought that if we were successful, maybe we could inspire some other people along the way to go after a crazy dream of their own.
When Kara and I used to tell people we traveled full-time, we’d almost always get the same response: “I wish I could do that.” At that point in the conversation, I would usually just bite my tongue. I realize that, for some, full-time travel truly isn’t possible. But for most of the people who say, “I wish I could do that,” they could if they really wanted to. Yes, some people would have to work harder than others, but most people could make it happen if they were willing to make travel a priority.
One of the selfish reasons we started these reports was to show people that we weren’t trust fund kids, and to prove to them that travel doesn’t have to be expensive. We were sharing the exact numbers behind how 2 normal people could travel the world for a year for $35,000. The hope was that, down the road, we could also show how it was possible to start a business while traveling that would continue to fund our travels, but it was just a dream at that point.
Fast forward 3 years, and we can’t believe where that dream has taken us!
Because of this path we’ve found ourselves on, I feel like the purpose of these income and expense reports have shifted. When we started, I felt like the numbers we were sharing were very relatable to the average person who wanted to go and travel. We were writing as 2 broke newlyweds, and the reports proved that you didn’t need a lot of money to go travel.
Now, I feel like these reports have become much less relatable from a travel expense standpoint, and they aren’t serving their original purpose. For a long time, I went back and forth on whether or not to continue publishing these reports, but I ultimately realized that they are now serving a different purpose that I never intended them to serve.
Based on the feedback I’ve started receiving, these reports are inspiring others outside of the realm of travel to pursue whatever they’re passionate about. This is really special to me. I’ve known from the beginning that it’s not everyone’s dream to travel (I have family and friends who would hate living a week in our shoes). That’s why I’ve never wanted to preach “everyone should travel full-time or you aren’t living life to the fullest.”
However, I do believe far too many people get swept up in the current of life and just end up wherever it takes them. Then, they look up one day and wonder how they got there. If I can inspire people to at least think about what they really want in life and encourage them to start pursuing it some way, I consider that a success.
So I am going to continue writing these reports (at least until we hit 100 countries) to show people a real-life case study about two people who went against the grain to pursue something they were really passionate about. And it worked out better than they ever could have imagined.
I think most people believe you have to make a choice between pursuing your passion or making money. We’re proof that it doesn’t have to be one or the other. We didn’t go into this thinking we were going to start a successful business. We just wanted to have enough money to continue traveling. But because we started doing what we really enjoyed and worked really hard at it, we’ve found ourselves somewhere we never dreamed of being.
Thoughts on Quarter 2 of 2019
In Q2 we saw a $27,000 decrease in revenue from Q1. The crazy thing is, all of our revenue streams stayed very consistent except for one. Our sponsorship revenue decrease by $26,000 accounting for almost 100% of our loss in revenue this quarter.
With that said, it’s not something we’re necessarily disappointed about. Sure it would have been nice to have the extra sponsorship income, but hear me out… The way we approach sponsorships is very passive. At this point in our YouTube journey, we’re fortunate enough to have a lot of companies reaching out to us for partnerships. We are very strategic about which companies we choose to promote, and we turn down the majority of opportunities we receive.
We usually only say yes to one or two sponsorship opportunities per month to keep the ads on our channel to a minimum. However, this quarter we launched FareDrop, and we didn’t want to overcrowd our channel with other promotions, so we only said yes to opportunities that were a perfect fit – which turned out not to be very many.
So while our sponsorship revenue decreased, it was a conscious choice, and it gave us more opportunities to promote FareDrop. This has been the biggest project we’ve worked on since launching our YouTube channel, so we’re really excited about it from a business standpoint – but we’re also excited because we just launched in May, and we’ve already helped people save over $10,000 on flights!
FareDrop is the first revenue stream we’ve created since we started traveling that won’t be included in these reports. We partnered with a developer to create this service, so we want to respect his financial privacy since not everyone is comfortable sharing their finances with the world.
In case you haven’t heard about FareDrop, it’s a new service we launched that helps you find cheap international flights up to 80% off! We worked with a developer to create a software the searches over 100,000 flight combinations per day. Our members can tell us what kind of deals they want to receive, and when we find a great deal that matches their preferences, we send it to them via email and/or text so they can book the flight!
If this sounds like something that could be useful to you, you can try it free for 30 days!
Income Report
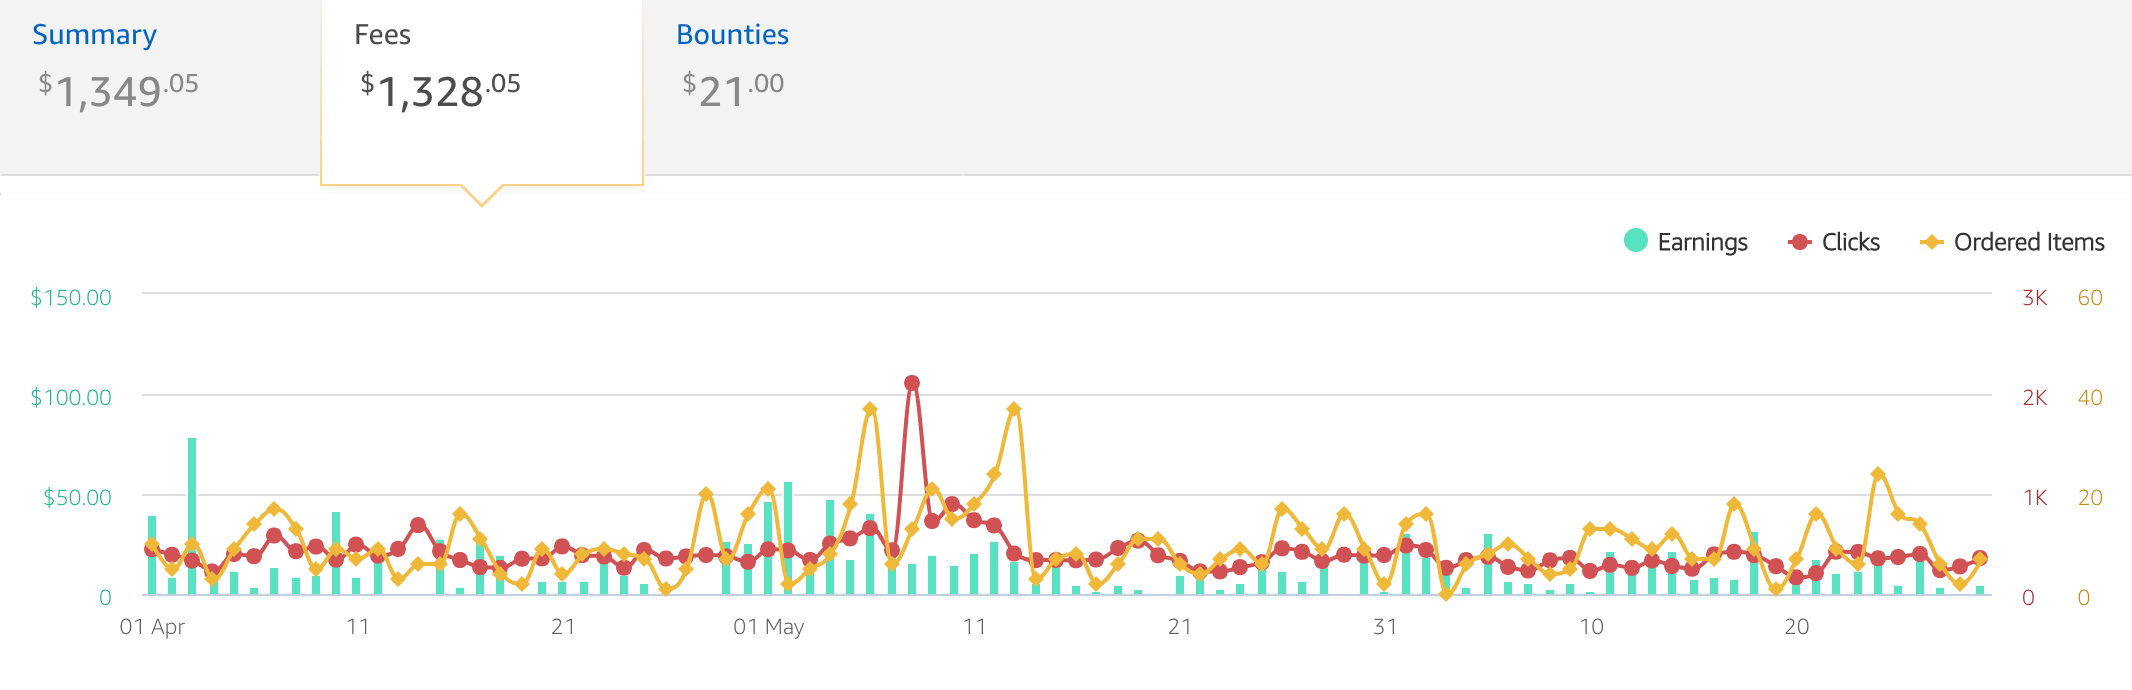
1. YouTube Ad Revenue – $32,515.55 (Change from Q1 +865.87)
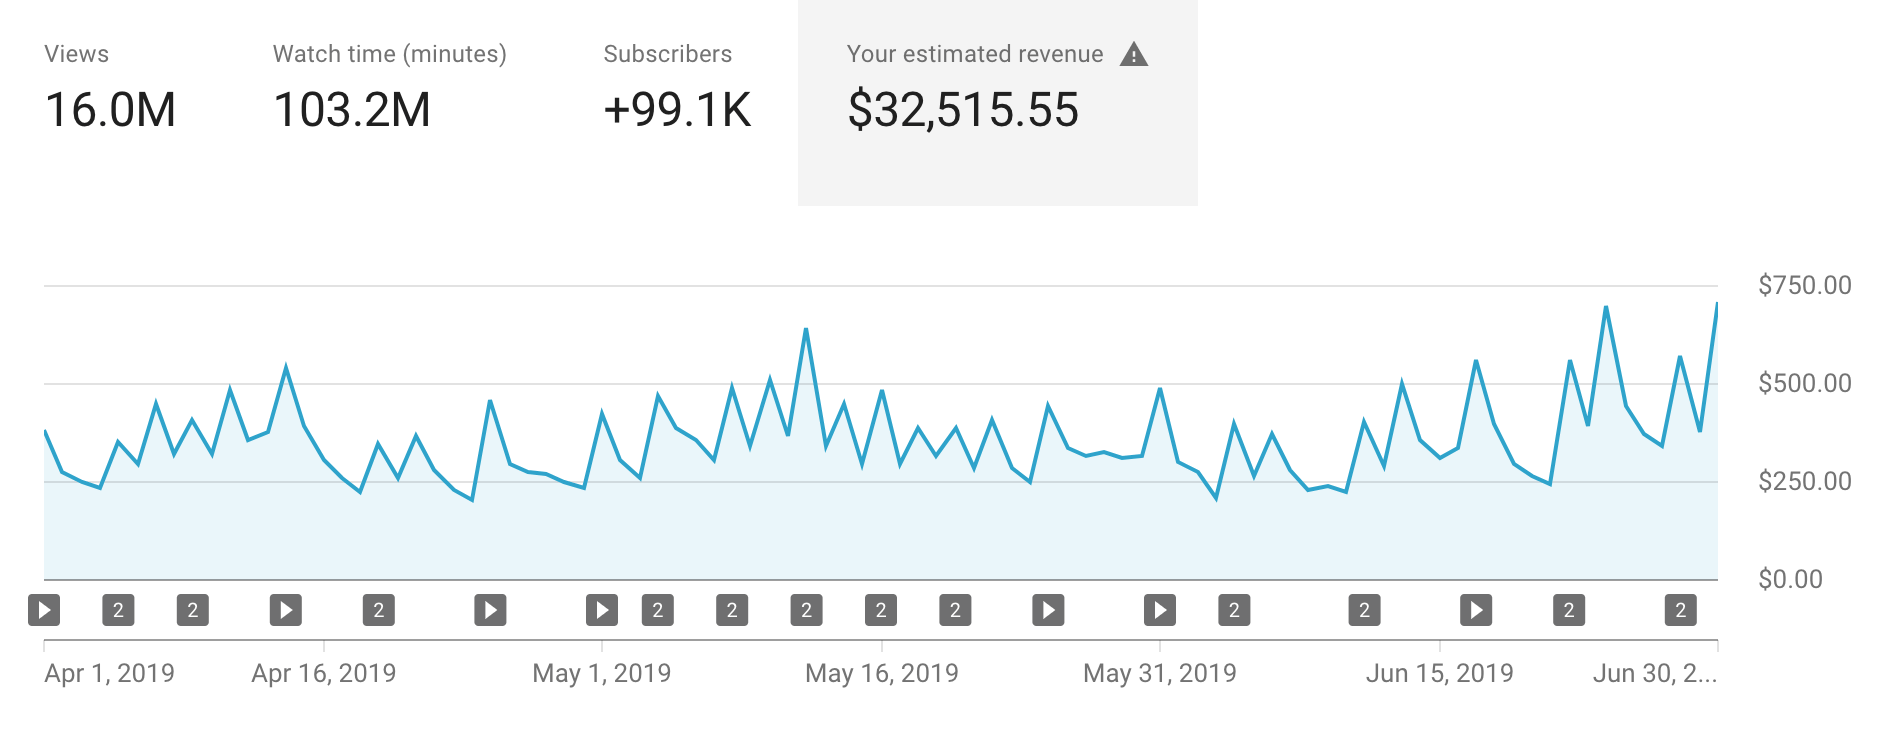
Our total monthly channel views and ad revenue has been extremely consistent since the beginning of the year. It seems like no matter how many videos we post or how well the videos do, YouTube is determined to keep our monthly views at around 5 million and our ad revenue at around $10,000 per month.
On the one hand, this can be a little frustrating because when we continually put more effort into our videos, we hope to be rewarded with growth. On the other hand, 10k per month in ad revenue is a great place for our growth to plateau, and you will never hear us complain about our channel receiving 5 million views per month. I just find it interesting that things have been so consistent. It feels like if we are slow publishing videos or if some videos don’t do as well as others, YouTube find other older videos to promote to make sure our channel continues receiving enough views. However, if we’re publishing more videos and the videos are getting more views than normal, it’s like YouTube stops promoting our older videos to make sure our channel doesn’t get too many views. Just an observation…
2. Patreon & PayPal – $10,963.85 (Change from Q1 +$1,226.51)
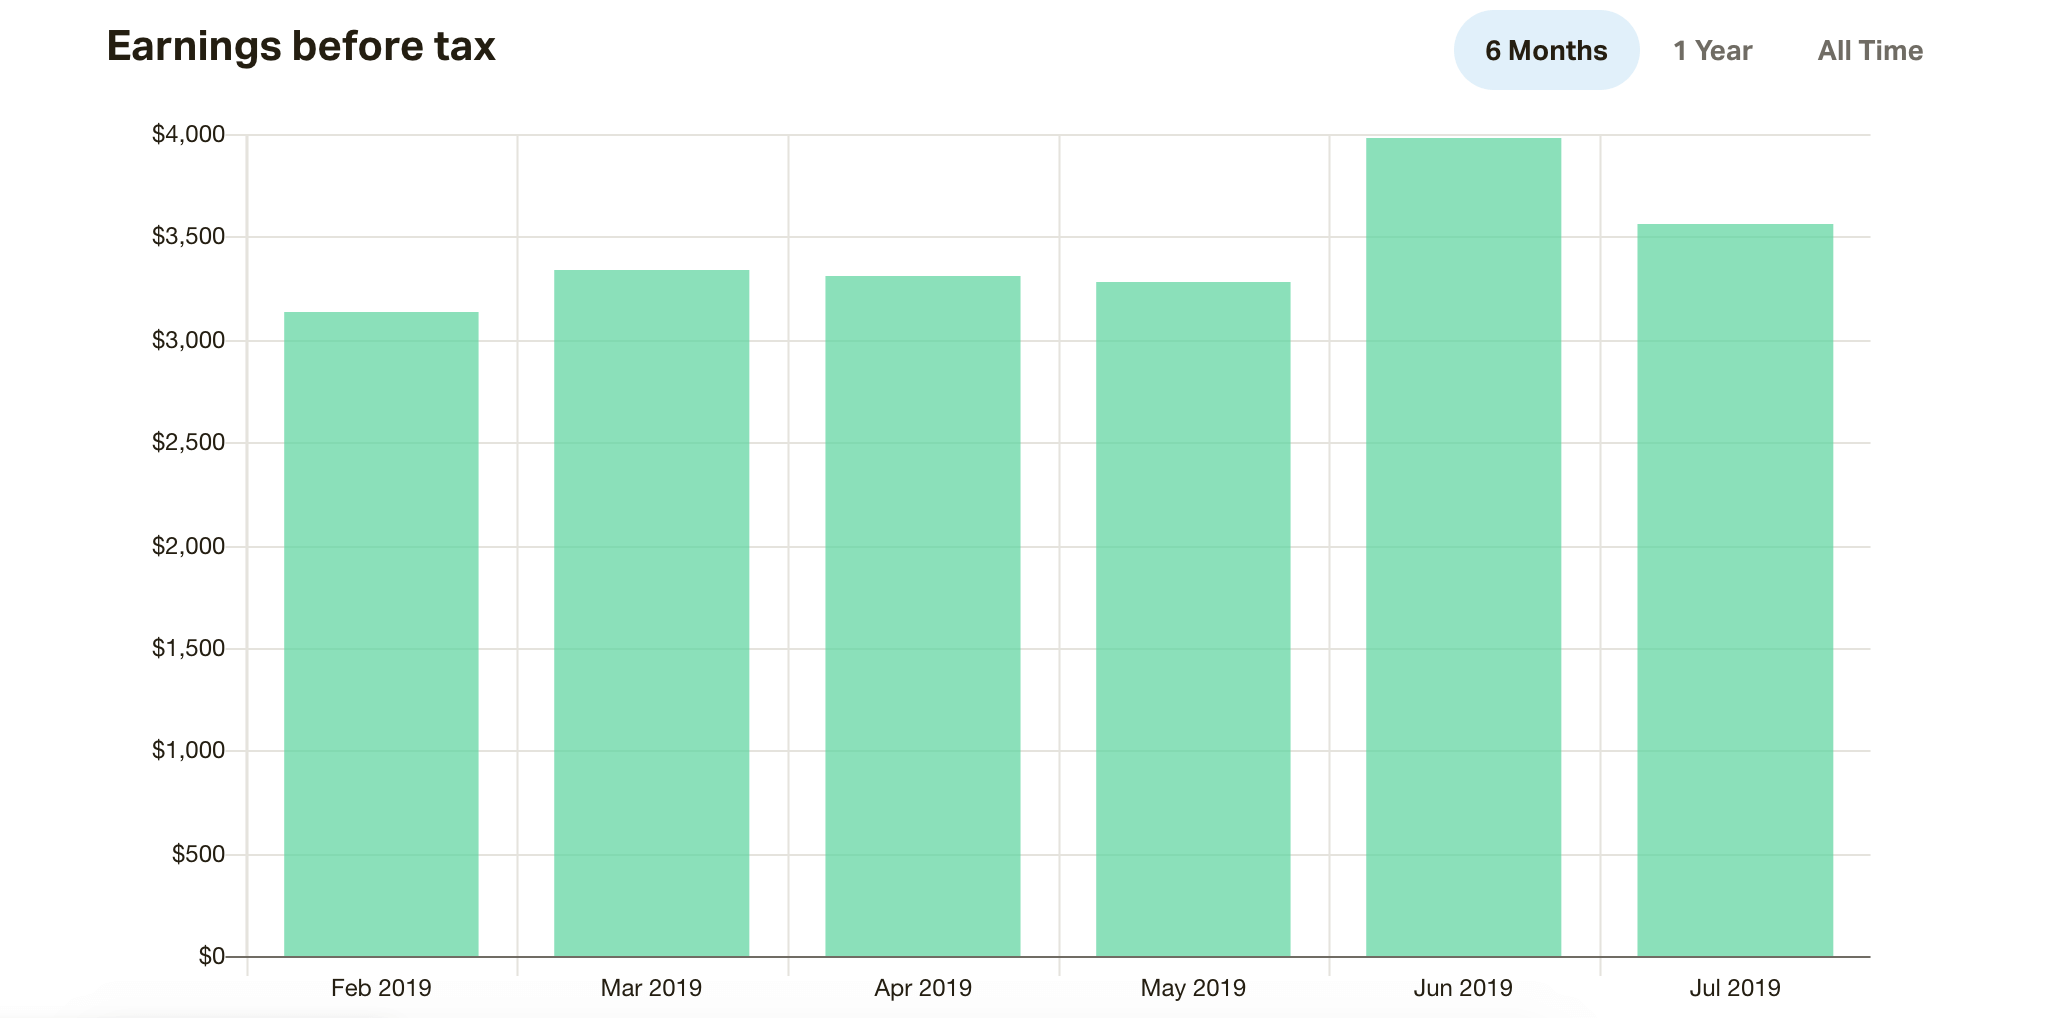
It’s scary to build a business on top of a platform that you don’t own (if you read the section above, you can see how much control YouTube has over our monthly ad revenue). So much of our success/failure is tied to the growth of our YouTube channel, and we have very little control over that growth. This is why we’re so grateful for our patrons! Thanks to their support, we know that no matter what YouTube decides, this is one consistent source of income that we can count on every month!
For those of you who aren’t familiar with Patreon, it’s an online platform that allows you to support the work of your favorite creators giving them a chance to continue working on their creations without having to worry about where their next meal is going to come from!
CLICK HERE to learn more about becoming a patron!
3. Course Sales – $8,205.00 (Change from Q1 -$1,553.00)
Outside of placing links on our website and in the description of our YouTube videos (goes to check we’re still linking to these in the description of our videos), we didn’t do any promotion for these courses this quarter, but they still brought in a decent amount of passive income.
If we’re being completely honest, neither one of us has been motivated to promote our course because we both feel like they need an update. The courses are still super valuable, which is why we haven’t taken them down, but we’ve both learned a lot since building the courses, and we have so much content we want to add. However, it’s one of those things that keeps getting pushed down the to-do list as things like posting videos and figuring out where we’re going to sleep tend to get top priority. Hopefully we can get these updated before I write up next quarter’s report.
If you don’t know what online courses I’m talking about… We’ve each created a course to teach others the subjects where we have the most expertise. For me, that’s travel hacking, and for Kara, it’s video editing.
- 30 Days to Becoming a Travel hacker is a course I created to teach others the strategies I use to save thousands of dollars on flights and hotels.
- Kara’s Behind the Scenes Guide to Creating a Vlog is the course Kara created to let you watch over her shoulder and learn the exact methods she uses to create one of our travel vlogs.
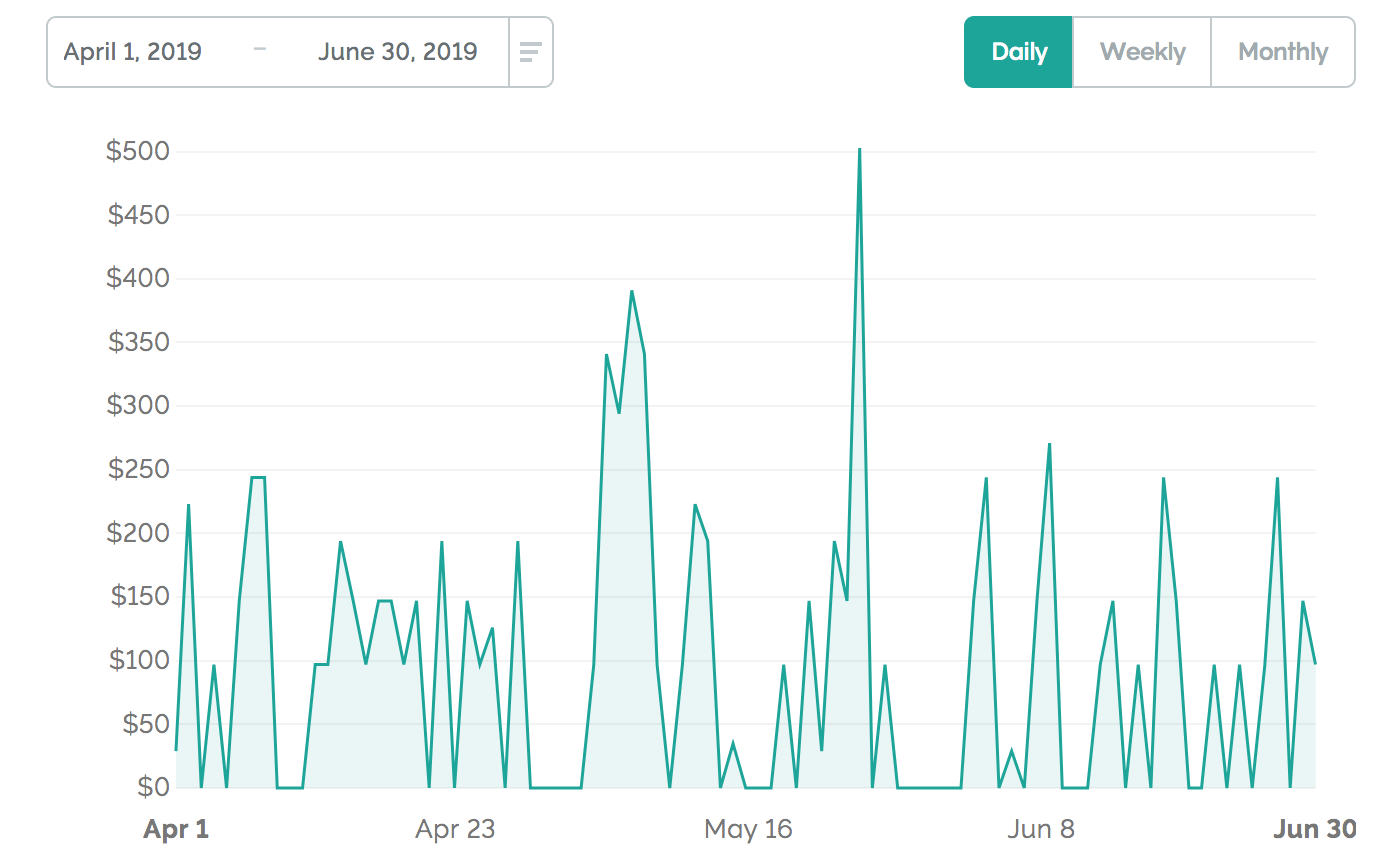
4. Affiliate Income – $21,540.55 (Change from Q1 +$9.93)
- Amazon – $1,355
- Epidemic Sound – $3,480
- Creditcards.com – $16,047.40
- Audible – $105
- ConvertKit – $72.69
- Adobe – $352.84
- TubeBuddy – $127.62
The majority of our affiliate income comes from the ongoing promotion of companies and products we love such as Amazon, banks with awesome travel credit cards, and Epidemic Sound. It’s an awesome feeling to get rewarded for doing something we are already doing for free: recommending products we use and love.
The major driver of our affiliate income this year has been credit card referrals. The data we receive around these referrals isn’t very detailed, but I’m pretty sure the major driver of referrals is from our free credit card consultation service where we help people find the best travel credit card(s) that will help them achieve their travel goals.
It is a manual and time consuming to talk with each person about their specific situation and make sure we’re recommending the right card(s). So, it’s awesome that we’re able to offer this service for free thanks to the commissions we receive from the banks.
If you’d like help figuring out which travel credit card(s) to sign up for to maximize your rewards and savings, you can request a FREE consultation by clicking the button below!
Or you can check out our Top 10 Travel Credit Cards post that we update every month!
Our second largest source of affiliate income is Epidemic Sound. We get all the music for our YouTube videos through this service. It’s hard to find good music for YouTube videos. Kara used to waste hours of her life searching for music, and now she has a huge library of royalty-free songs to choose from! She loves this service, promotes it at the end of all of our videos, and we get paid anytime someone signs up for a free trial.
If you need music for YouTube videos, click here to check out Epidemic Sound!
Last but not least, Amazon also brought in a decent amount of affiliate income. The majority of our Amazon affiliate income is generated by people who visit the following pages where we recommend gear we use and love.
Our Vlogging Gear
Our Packing List
Keep Us on the Road
5. Sponsored Content – $15,300 (Change from Q1 -$27,370)
As our channel grows, we continue getting more and more opportunities to include sponsors in our videos. It seems like every day someone sends me an email asking us to review their product on our channel. We turn down the majority of these offers, but if the product/company meets our 3 criteria, then we entertain the idea of adding them as a sponsor:
- Can we get genuinely excited about the product/company?
- Is this something we think our viewers would be interested in knowing more about?
- Does the company value our platform, and are they willing to pay us enough money?
We do not proactively reach out to companies to set up a sponsorship. I believe 100% of the money we’ve made from sponsorships this year has come from companies approaching us wanting to work together. With said, the majority of companies who reached out to this quarter didn’t mean at three of the criteria we have listed above. So, we turned down the majority of the opportunities.
Plus, we feel that our followers have a limit for how many sponsorships they’ll watch on our channel before the entire channel starts to feel like one big ad so we try to keep our sponsorships to a minimum. Since we knew we’d be spending more time promoting FareDrop this quarter we were even more intentional about saying “no” to opportunities that weren’t a perfect fit.
Total Q1 Income – $88,524.95 (Change from Q1 -$26,820.69)
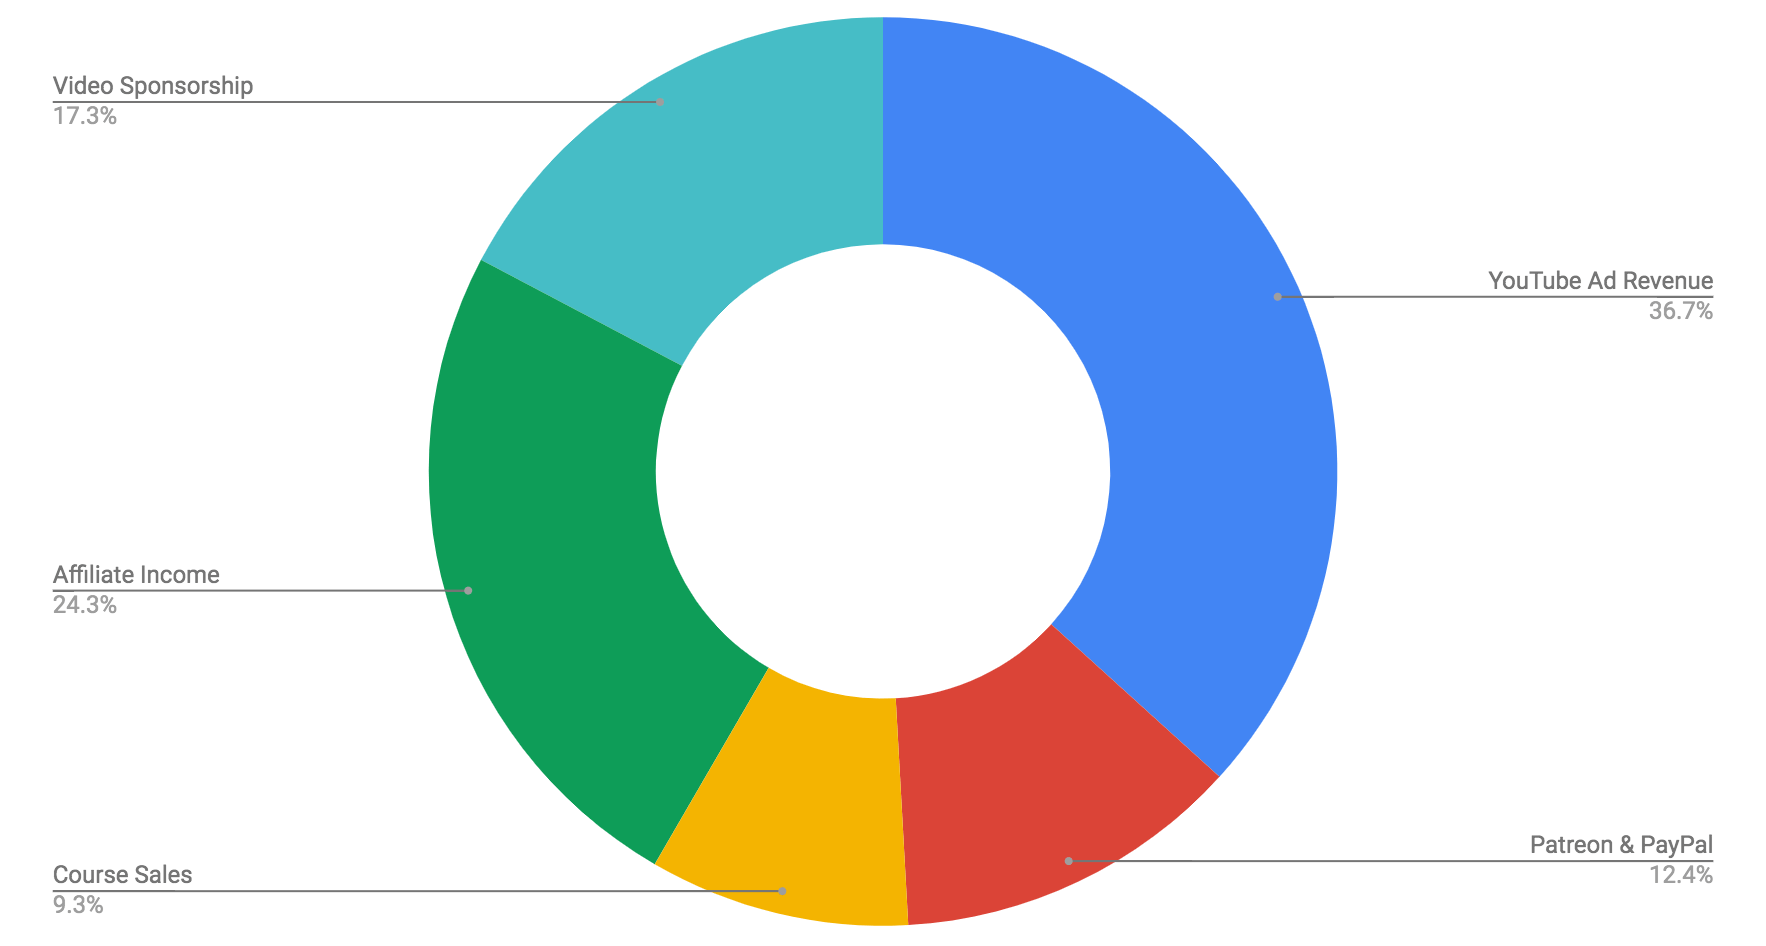
The pie chart above gives you a quick breakdown of how each revenue stream is contributing to our total income.
Expense Report
Transportation Expenses – $6,719.34
Normally, we save money on our transportation expenses using miles and points that we’ve saved up by applying for the best travel credit cards. However, this quarter, we spent more than usual on transportation because we ended up buying four business class tickets.
Back in January, we found a business class “error fare”, and we were able to book two flights from Da Nang, Vietnam to New York for only $695 per ticket. Normally, these tickets would cost $5,000 to $10,000 each. We didn’t have plans to travel to Vietnam or New York, but the deal was too good to pass up!
We love any chance we get to travel in business class, so it was worth $695 to us just be able to try out one of the top 10 business class products in the world for the 16-hour flight between Hong Kong and New York.
The reason we booked 2 of these flights is because the second flight enabled us to earn significantly more frequent flyer miles plus Platinum Status with American Airlines! So the benefits we earned were worth more than what we paid for the flights. After flying 4 of these 16 hour flights around the world (in addition to all of our other travel), it felt like we pretty much lived on airplanes for most of quarter 2. It was a lot of flying, but we would both do it again in a heartbeat. 🙂
| Origin | Destination | Transport | USD | Misc. |
|---|---|---|---|---|
| Total | $6719.34 | |||
| Copenhagen | Cabo San Lucas | Plane | $1355.03 | |
| Cabo San Lucas | Todos Santos | Rental Car | 1459.39 | Rental Car for 3 Weeks |
| Cabo San Lucas | Nashville | Plane | $553.90 | |
| Nashville | Seoul | Plane | $307.60 | |
| Seoul | Ho Chi Minh | Plane | $400 | |
| Ho Chi Minh | Da Nang | Train | $93.28 | |
| Da Nang | New York | Plane | $795.90 | Business Class |
| New York | Michigan | Rental Car | $376.01 | |
| New York | Da Nang | Plane | $795.90 | Business Class |
| Da Nang | Australia | Plane | $0 | Project with PADI |
| Australia | Da Nang | Plane | $0 | Project with PADI |
| Da Nang | New York | Plane | $695.23 | Business Class |
| New York | Nashville | Plane | $259.80 | |
| Nashville | New York | $259.80 | ||
| New York | Da Nang | $695.23 | Business Class | |
| Da Nang | Hanoi | $131.66 |
Accommodation Expenses – $4,449.16
In case you haven’t been following the Airbnb drama over the last few income and expense reports:
In the past, we have saved a lot of money on accommodations thanks to Airbnb credits that we have accumulated through people signing up for the service through our link. However, midway through last year, we abruptly stopped receiving credits from Airbnb.
With no help from Airbnb, we eventually learned that Airbnb has a $5,000 credit limit cap. Since we had received $5,000 in credits, they quit giving us additional credits even though we were still referring new members.
To get around the cap, we created a new account, and we want to say huge thank you to everyone who used our new link this quarter because we have already earned an additional $1,300 in Airbnb credits! If you’d like to save $40 on your first Airbnb, and give us some Airbnb credit as well, you can sign-up using our new link below.
CLICK HERE to save $40+ on your first Airbnb
| Location | Accommodations | Nights | Cost | Misc. |
|---|---|---|---|---|
| $4,449.16 | ||||
| Los Angles | Hotel | 1 | $149 | |
| Todos Santos | Airbnb | 23 | $2,536.69 | |
| Nashville | Home | 7 | $0 | |
| Seoul | Airbnb | 7 | $671.75 | |
| Ho Chi Minh | Airbnb | 12 | $701.08 | |
| Michigan | Hotel | 4 | $417.96 | |
| Da Nang | Hotel | 1 | $55 | |
| Australia | Hotel | 12 | $0 | Project with PADI |
| Da Nang | Hotel | 1 | $62 | |
| Nashville | Home | 10 | $0 | |
| Da Nang | Hotel | 5 | $45 | Used Free 7 Night Marriott Certificate |
Destination Expenses – $2,786.62
This category is the money we spent while on the ground at each destination. This includes things like food, local transportation, and entertainment.
| Destination | Dates | Expenses |
|---|---|---|
| Total | $2,786.62 | |
| Todos Santos | April 1 - 23 | $818.16 |
| Nashville | April 23 - May 1 | $250.27 |
| Seoul | May 3 - 10 | $370.54 |
| Ho Chi Minh | May 10-21 | $511.20 |
| Da Nang | May 22-23 | $16.19 |
| Michigan | May 23 - 27 | $228.13 |
| Da Nang | May 29 | $13.71 |
| Australia | May 30 - June 12 | $213.67 |
| Da Nang | June 12 - 13 | $11.51 |
| Nashville | June 14 - 23 | $289.47 |
| Hanoi | June 25 - 30 | $63.77 |
Business Expenses – $7,959.75
Each month we pay for several online subscriptions and other things to keep the vlog, blog, online courses, and email list running smoothly. We have also hired a few independent contractors to make sure we can keep things going strong as our channel and business continue to grow and evolve.
Travel Hacking Wingman -$3,727.50
If you submitted a credit card consultation or signed up for my travel hacking course, you probably know Benji. He helps manage our travel hacking Facebook group for the students of my 30 Days to Becoming a Travel Hacker Course. He also helps me write travel hacking blog posts and give credit card consultations. I tried to do this alone for a long time, but I realized I needed help to ensure that we could help as many people as possible travel cheaper using my travel hacking strategies. So, I’m super thankful I’ve found a fellow travel hacker I trust to help me with the mission.
Video Editor – $2,768
After working with a few different editors, and spending a lot of time trying to figure out the best way to transfer big video files around the world, we finally have a system that we’re happy with! We are down to one awesome editor who helps rough-cut almost every video. The original goal of hiring a editor was to help save Kara time in the editing process. At this point that’s still debatable, but it’s definitely increased the quality our videos which we’re really happy about!
Assistant – $165
At the end of this quarter we hired a part-time assistant who just works 5-10 hours per week to help with some of the repetitive tasks that were taking up too much of our time.
Convert Kit – $0 (we paid upfront for the year)
The great email platform that we use to send emails to our list of 50,000+ people. It’s great!
Teachable – $297
The platform where we host our courses – 30 Days to Becoming a Travel Hacker and Kara’s Behind the Scenes Guide to Editing a Vlog.
Premiere Pro (Adobe) – $223.65
The program Kara uses to edit our videos.
Google Service – $61.48
This is the money we pay Google for our email address every month so that we can look semi-professional.
Touchnote Postcard – $179.95
This is the service we’re using to send postcards to our patrons!
Epidemic Sound – $45
This is where we get all of our royalty free music for our YouTube videos!
TubeBuddy – $57
This service allows us to bulk edit the cards and end screens across all of our videos on YouTube. Basically, we pay $19 to avoid spending hours of our lives monotonously changing small details on our channel.
Godaddy – $18.17
This is the service we use to pay for our website, hosting, and SSL certificates. Plus, all of the other domains I buy when I think of a good business idea 😉
Gleam.io – $0
This is the service we used to host our giveaways.
Click Funnels – $291
“I’m trying to get more sophisticated with our landing pages and sales funnels, but so far I’m just wasting money with this complicated service.” I wrote this in the last quarter, but it’s still true.
Motion Array – $87
This was a service we tried out for animated text and maps. It didn’t work out.
VideoBlocks – $39
This was a service we used for stock footage to help us tell a better story in one of our videos.
OptinMonster – $0 (we paid upfront for the year)
If you’ve been to our website, you may recognize we have a few popups on different pages. This is the service we’re using to generate more email subscribers.
New Gear – $1,838.11
We purchased several miscellaneous pieces of this gear this quarter including a couple of lens filters, hard drives, and new memory cards. However, the bulk of this expense comes from Kara’s new phone. Hopefully, you’ve noticed an increase in the quality of our Instagram stories… That was the justification for buying a new phone, haha.
Fixed Costs – $738.17
T-Mobile Phone Plan – $220.07
Google Fi – $296.34
Kara stuck with the T-Mobile Unlimited International plan because she can’t give up her iPhone. However, I decided to switch to Google Fi because it’s a lot faster than T-Mobile’s international service. Having separate carriers slightly increases our overall phone bill, but both of us are happy with our current setup.
Health Insurance – $221.76
We switched to a new international health insurance plan this year: it’s called Safety Wing. It’s cheaper, but we haven’t actually had to use it, so I can’t tell you whether or not we recommend it.
Passports & Visas – $1,199.98
Before we left to travel full-time at the beginning of 2016, we got brand new 52 page passports. After 3.25 years of travel, we finally filled them up. Because our time in the U.S. is limited, we had to pay a hefty fee to get rushed passports in one week. However, the amount we save on taxes by being outside of the U.S. was totally worth paying the rush fee so we could leave the U.S. faster.
Miscellaneous – $1040.31
This category is made up of expenses that didn’t fit into any of the categories above. Some little things like Spotify and Netflix, and a few bigger things like credit card annual fees.
Total Q1 Expenses – $26,259.73

Summary
| Total Profit | $62,265.22 | |
|---|---|---|
| Income | ||
| YouTube Ad Revenue | $32,515.55 | |
| Patreon | $10,963.85 | |
| Courses | $8,205.00 | |
| Affiliate Income | $21,540.55 | |
| Video Sponsorship | $15,300.00 | |
| Total Income | $88,524.95 | |
| Expenses | ||
| Transportation | -$6,719.34 | |
| Accommodations | -$4,449.16 | |
| Destination Expenses | -$2,786.62 | |
| Business Expenses | -$7,959.75 | |
| New Gear | -$1,838.11 | |
| Fixed Cost | -$738.17 | |
| Passport & Visas | -$1,199.98 | |
| Miscellaneous | -$568.60 | |
| Total Expenses | -$25,059.75 |
That’s a wrap for our Quarter 2 income and expense report. These numbers continue to surprise us every quarter when I type them into the computer. If you find it hard to believe that we’re making this much money while traveling the world, you’re not alone. We pinch ourselves from time to time!
Thank you for all of your support. We couldn’t do it without you. I’d love to hear what you think about this report in the comments below!