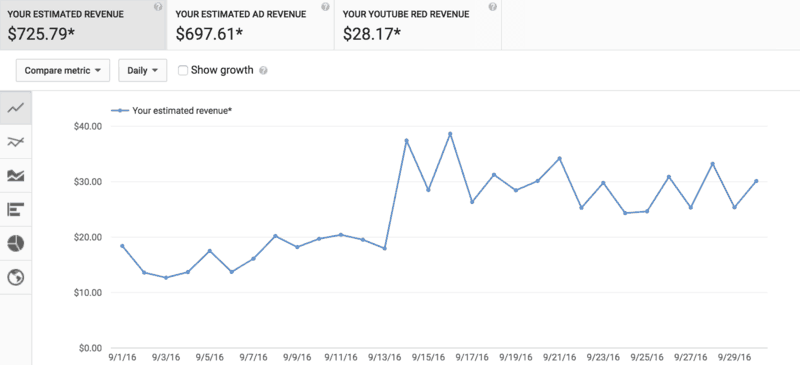
This is by far the best quarterly income and expense report we have ever posted, and the first one to ever break six figures in profits. However, before you dive into it, we want you to know that it hasn’t always been this way. If this is your first time ever reading one of our income and expense reports, I suggest starting with the first one we ever published in July of 2016 (our total income was $603.26)
Now that we’re making what feels like a crazy amount of money from this business, I feel like it’s important to tell you why we started writing these reports in the first place – and why I am continuing to write them (at least until we hit our goal of 100 countries).
When we first made these reports in our 6th month of full-time travel, the goal was to make enough money to cover our travel expenses so we could continue traveling. The purpose was to document that journey. We thought that if we were successful, maybe we could inspire some other people along the way to go after a crazy dream of their own.
When Kara and I used to tell people we traveled full-time, we’d almost always get the same response: “I wish I could do that.” At that point in the conversation, I would usually just bite my tongue. I realize that, for some, full-time travel truly isn’t possible. But for most of the people who say, “I wish I could do that,” they could if they really wanted to. Yes, some people would have to work harder than others, but most people could make it happen if they were willing to make travel a priority.
One of the selfish reasons we started these reports was to show people that we weren’t trust fund kids, and to prove to them that travel doesn’t have to be expensive. We were sharing the exact numbers behind how 2 normal people could travel the world for a year for $35,000. The hope was that, down the road, we could also show how it was possible to start a business while traveling that would continue to fund our travels, but it was just a dream at that point.
Fast forward 3 years, and we can’t believe where that dream has taken us!
Because of this path we’ve found ourselves on, I feel like the purpose of these income and expense reports have shifted. When we started, I felt like the numbers we were sharing were very relatable to the average person who wanted to go and travel. We were writing as 2 broke newlyweds, and the reports proved that you didn’t need a lot of money to go travel.
Now, I feel like these reports have become much less relatable from a travel expense standpoint, and they aren’t serving their original purpose. For a long time, I went back and forth on whether or not to continue publishing these reports, but I ultimately realized that they are now serving a different purpose that I never intended them to serve.
Based on the feedback I’ve started receiving, these reports are inspiring others outside of the realm of travel to pursue whatever they’re passionate about. This is really special to me. I’ve known from the beginning that it’s not everyone’s dream to travel (I have family and friends who would hate living a week in our shoes). That’s why I’ve never wanted to preach “everyone should travel full-time or you aren’t living life to the fullest.”
However, I do believe far too many people get swept up in the current of life and just end up wherever it takes them. Then, they look up one day and wonder how they got there. If I can inspire people to at least think about what they really want in life and encourage them to start pursuing it some way, I consider that a success.
So I am going to continue writing these reports (at least until we hit 100 countries) to show people a real-life case study about two people who went against the grain to pursue something they were really passionate about. And it worked out better than they ever could have imagined.
I think most people believe you have to make a choice between pursuing your passion or making money. We’re proof that it doesn’t have to be one or the other. We didn’t go into this thinking we were going to start a successful business. We just wanted to have enough money to continue traveling. But because we started doing what we really enjoyed and worked really hard at it, we’ve found ourselves somewhere we never dreamed of being.
Thoughts on Quarter 3 of 2019
I don’t like to brag. That’s not why I started writing these reports. They actually get harder and harder to publish as we continue to make more money, but If I’m being completely honest, I’m really proud to get to publish this report.
Just two and a half years ago, we were still digging into our personal savings and spending that money to continue traveling and make these videos. It’s incredible to look back at how much things have changed financially in such a short amount of time.
I definitely didn’t expect to be writing this back in July when the quarter started. However, thanks to a semi-viral video that lead to substantial channel growth, and two of the biggest sponsorships we have ever received, we broke six figures in profit for the first time this quarter.
Grab a cup of coffee, and dive into the report below to read all the details.
Income Report
1. YouTube Ad Revenue – $50,707.67 (Change from Q2 +$18,192.12)
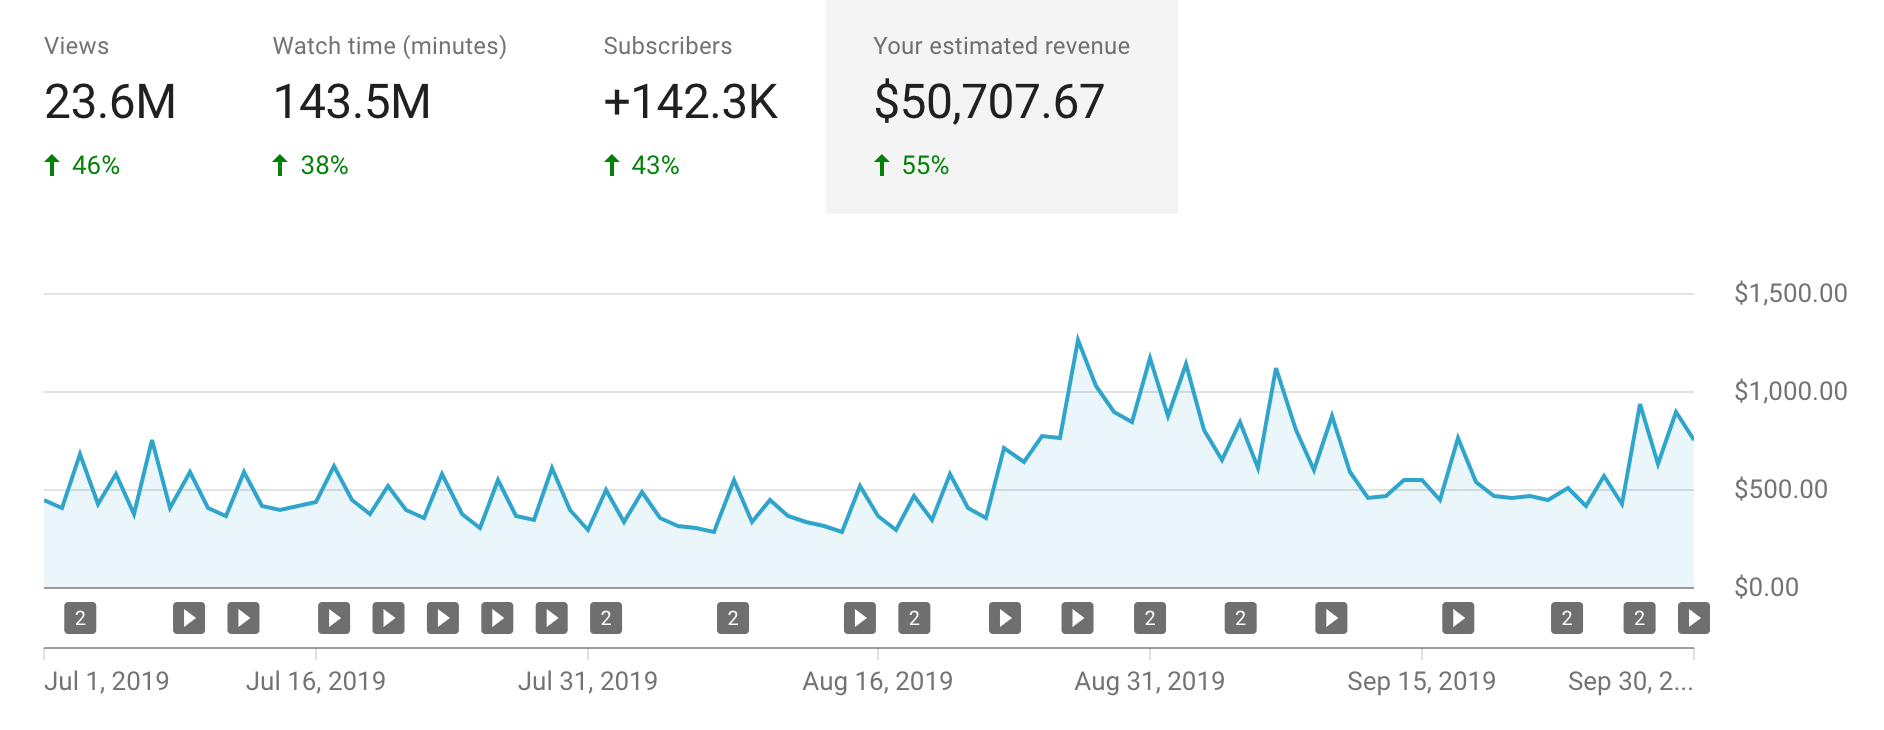
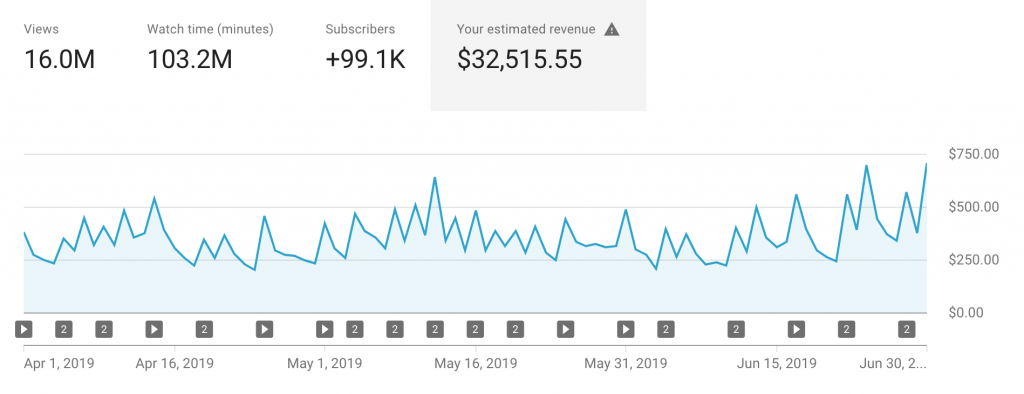
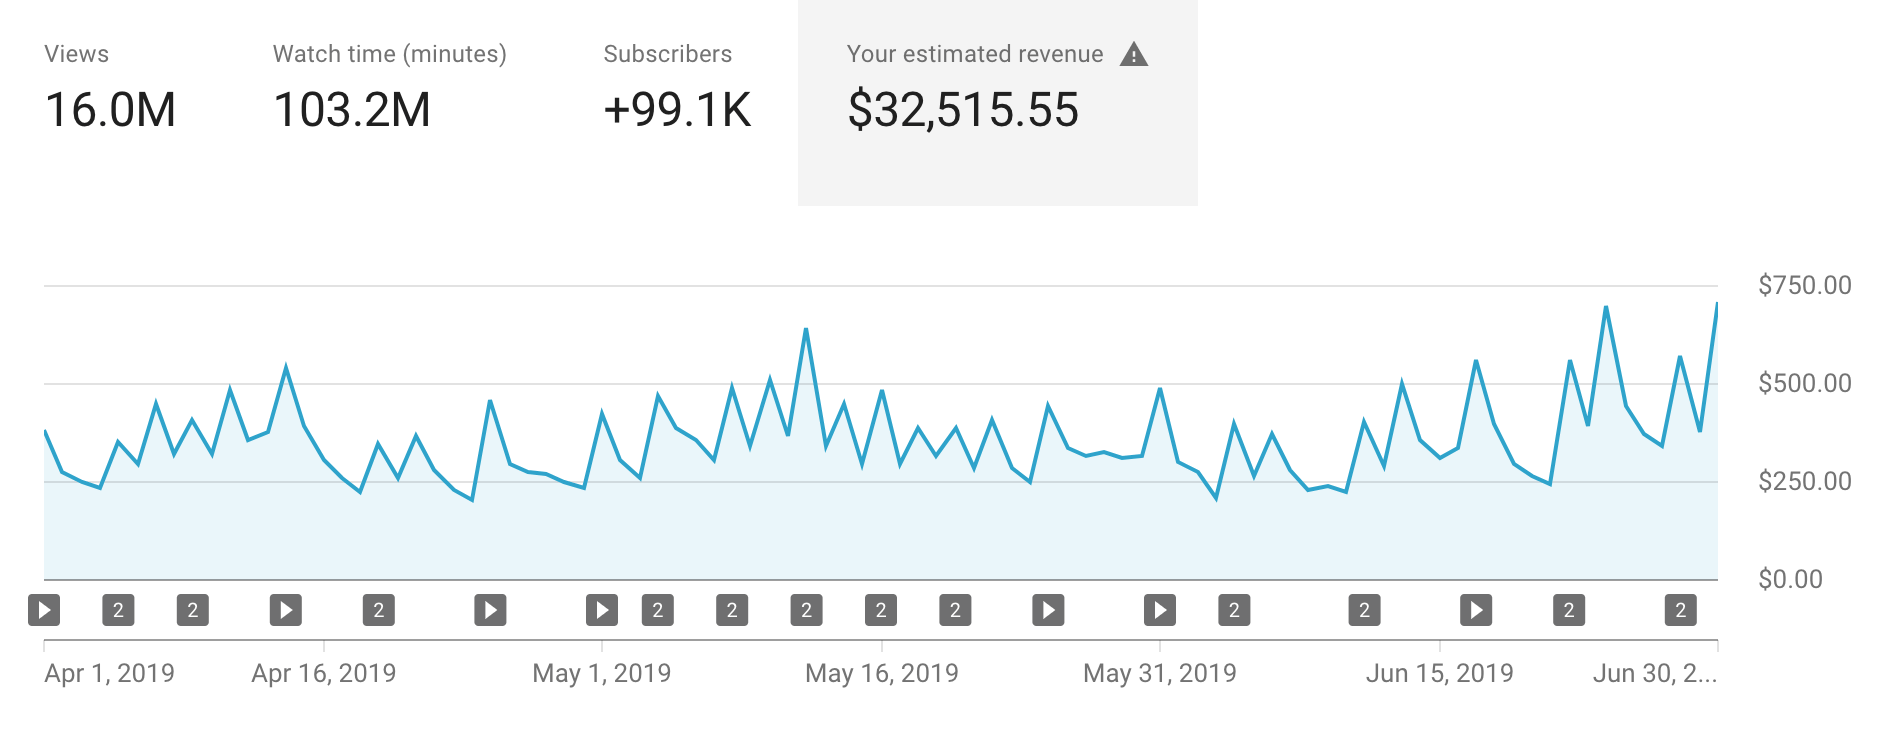
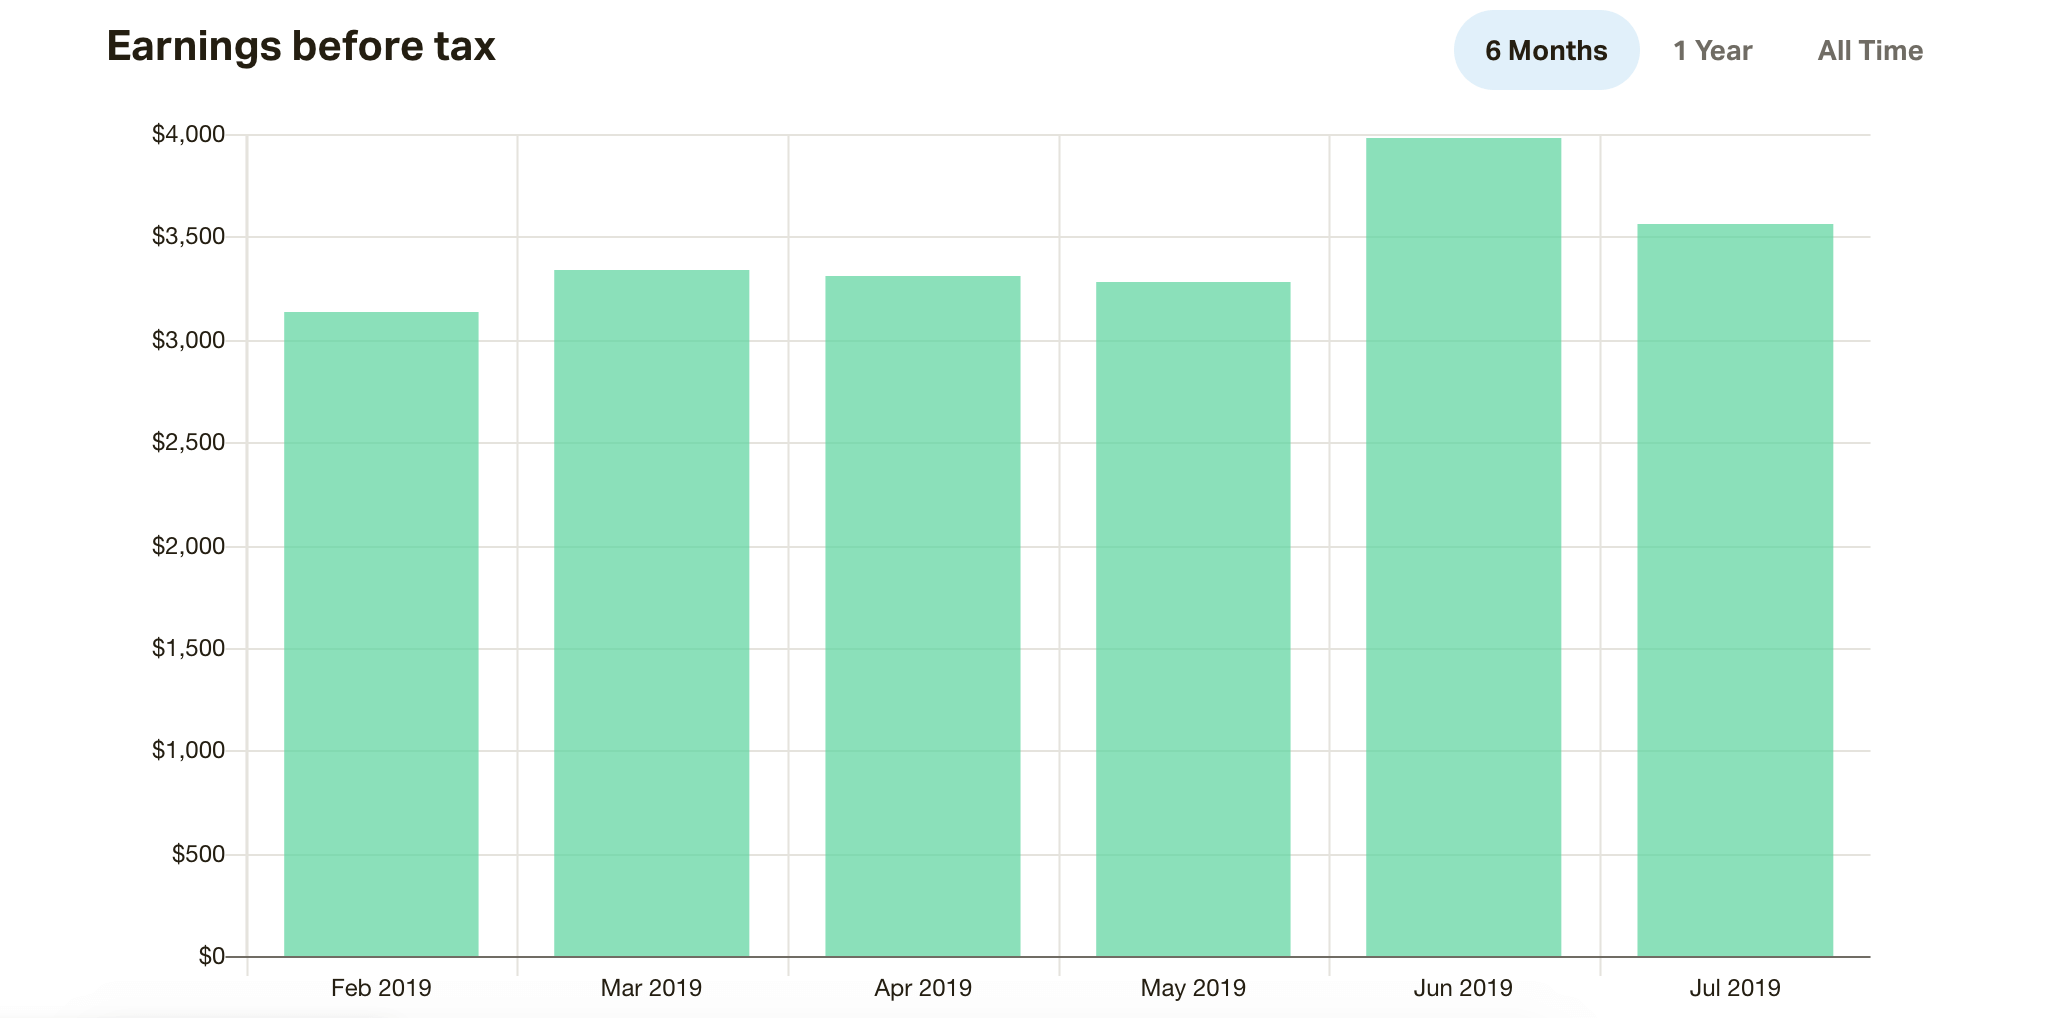
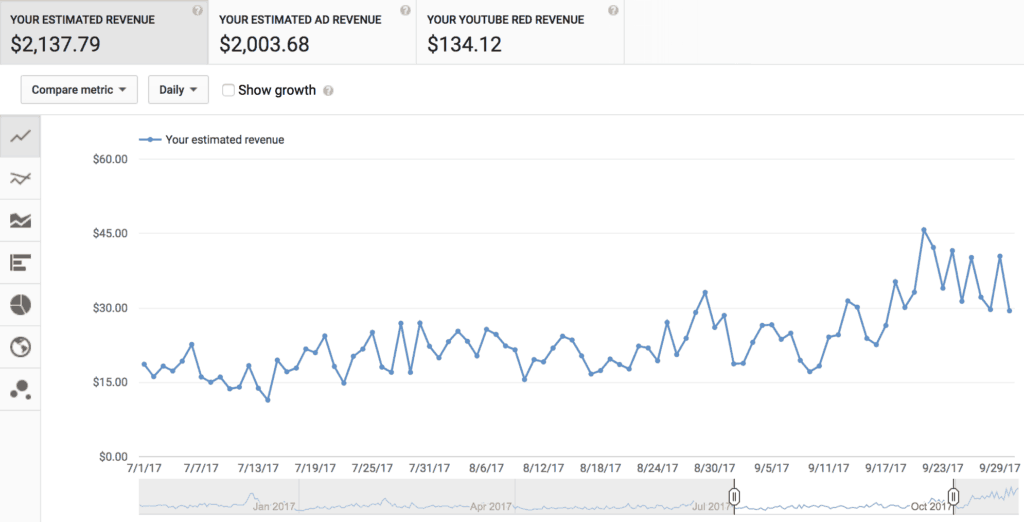
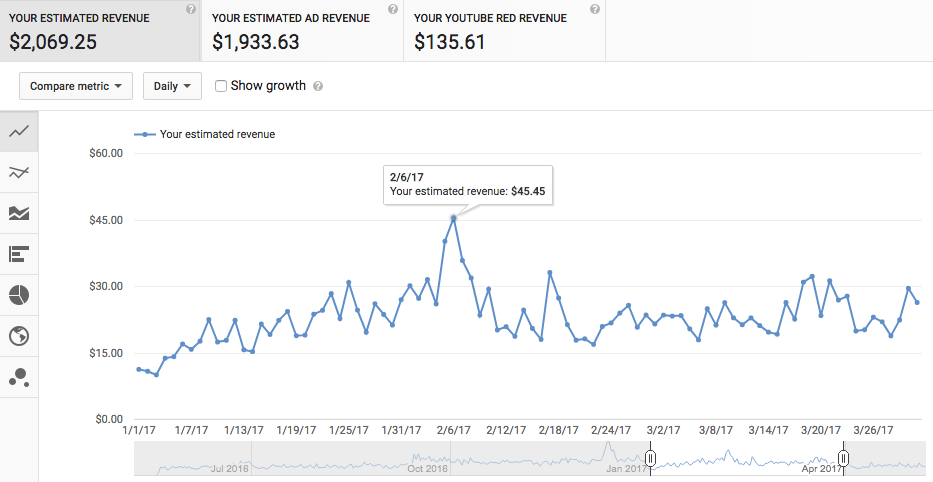
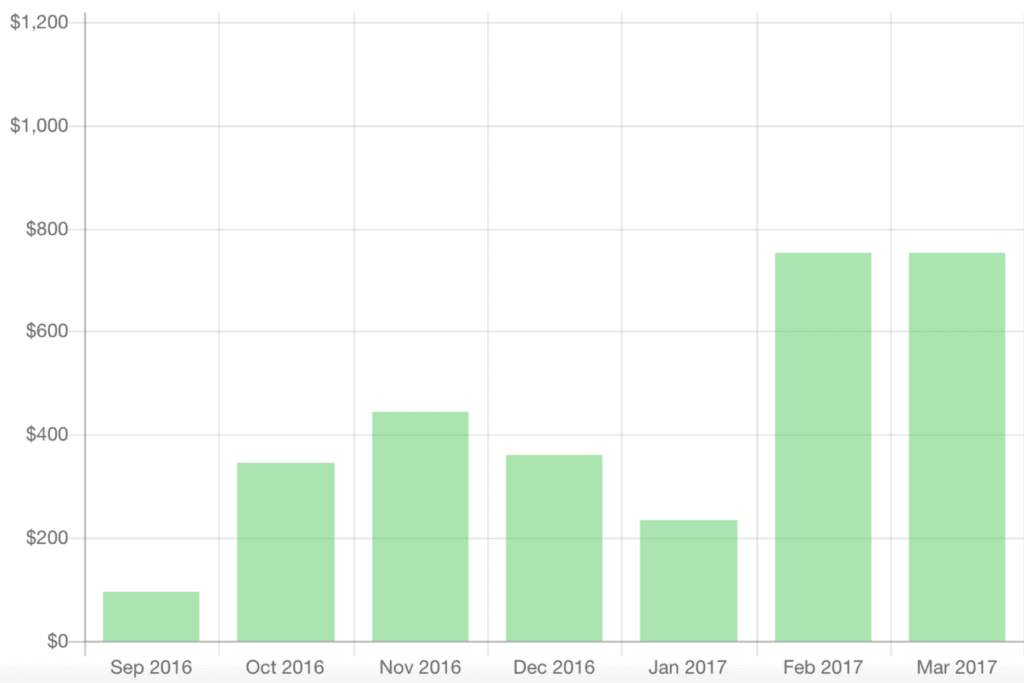
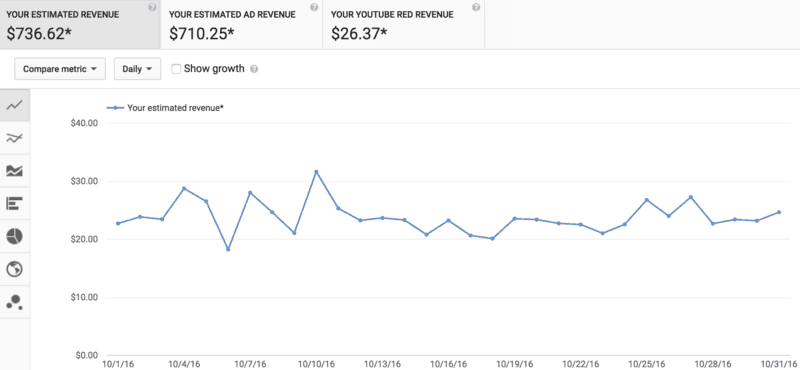
In last month’s report, I mentioned how consistent our channel growth and ad revenue had been for the first half of the year. It seemed like no matter what we did (for better or for worse) our channel continued to grow at the same rate, and our ad revenue hovered right around $10,000 per month.
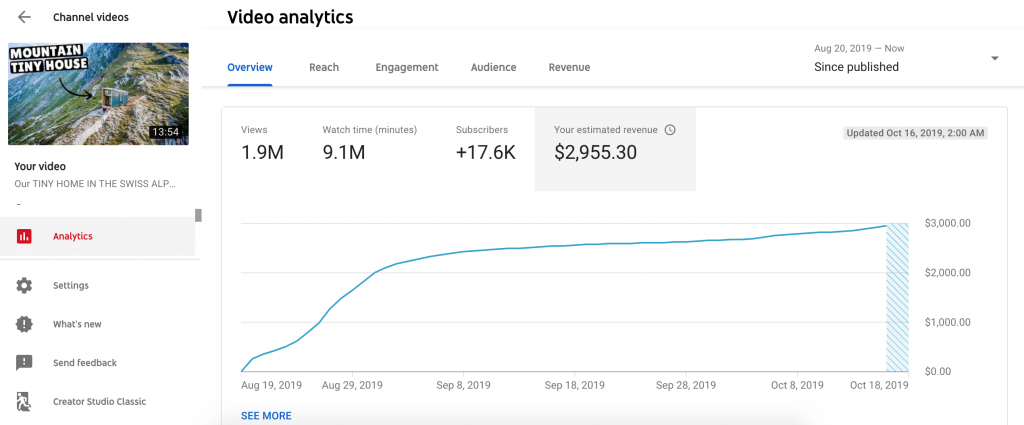
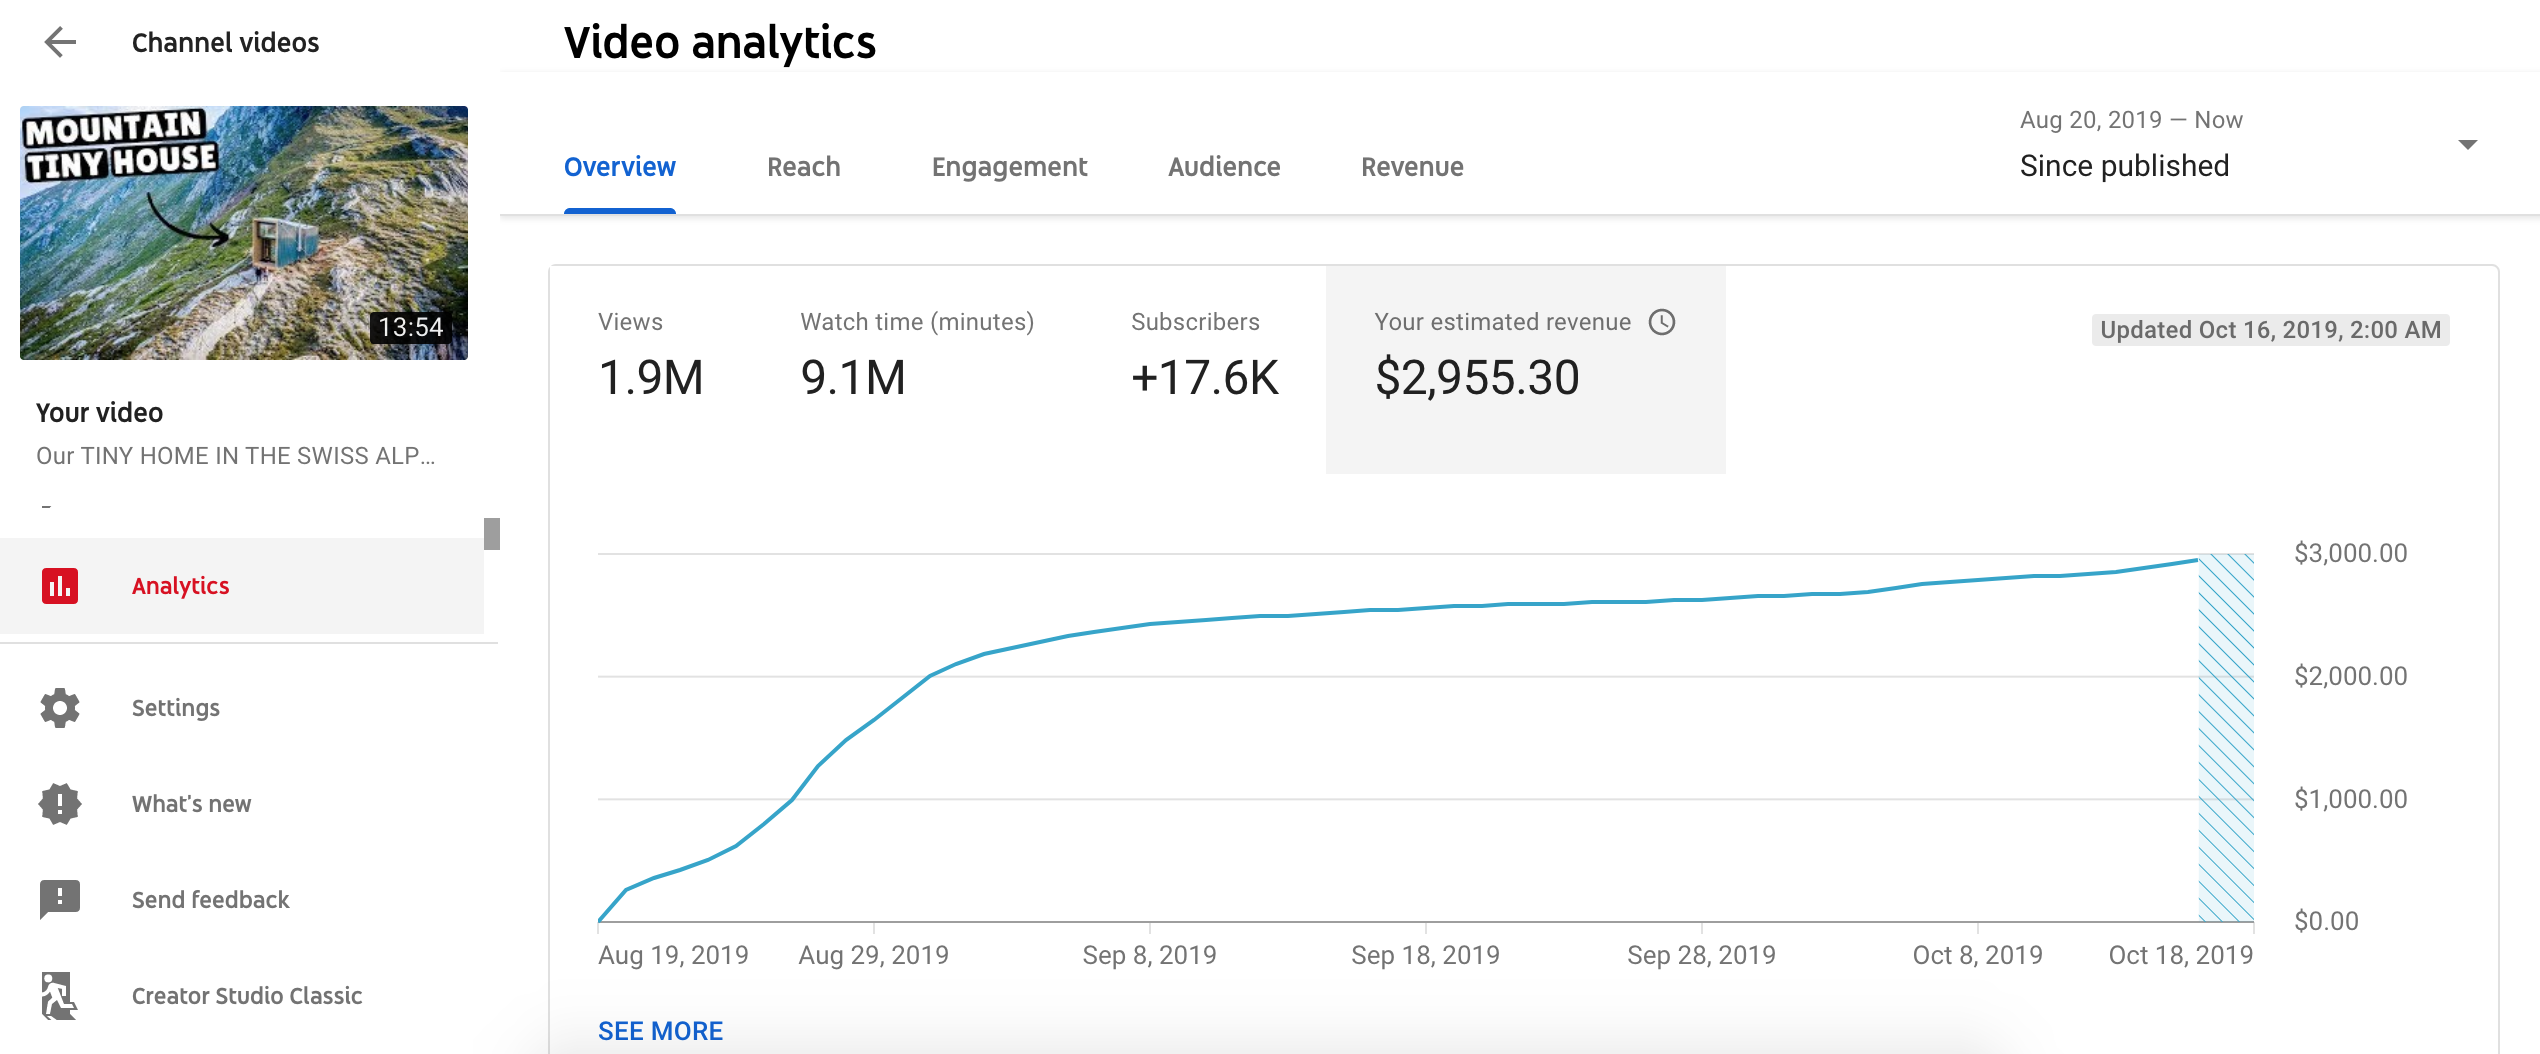
This quarter, we saw a major jump in channel growth and ad revenue for the first time in 2019. It’s crazy how much a difference one video can make. In mid-August we published a video called “Our Tiny Home in the Swiss Alps” and within a week, the video had hit 1 million views.
The best part for us about a video like this going semi-viral is not the ad revenue we receive from that specific video. Instead, it’s the number of new people it brings to our channel who stick around, watch more videos, and become subscribers.
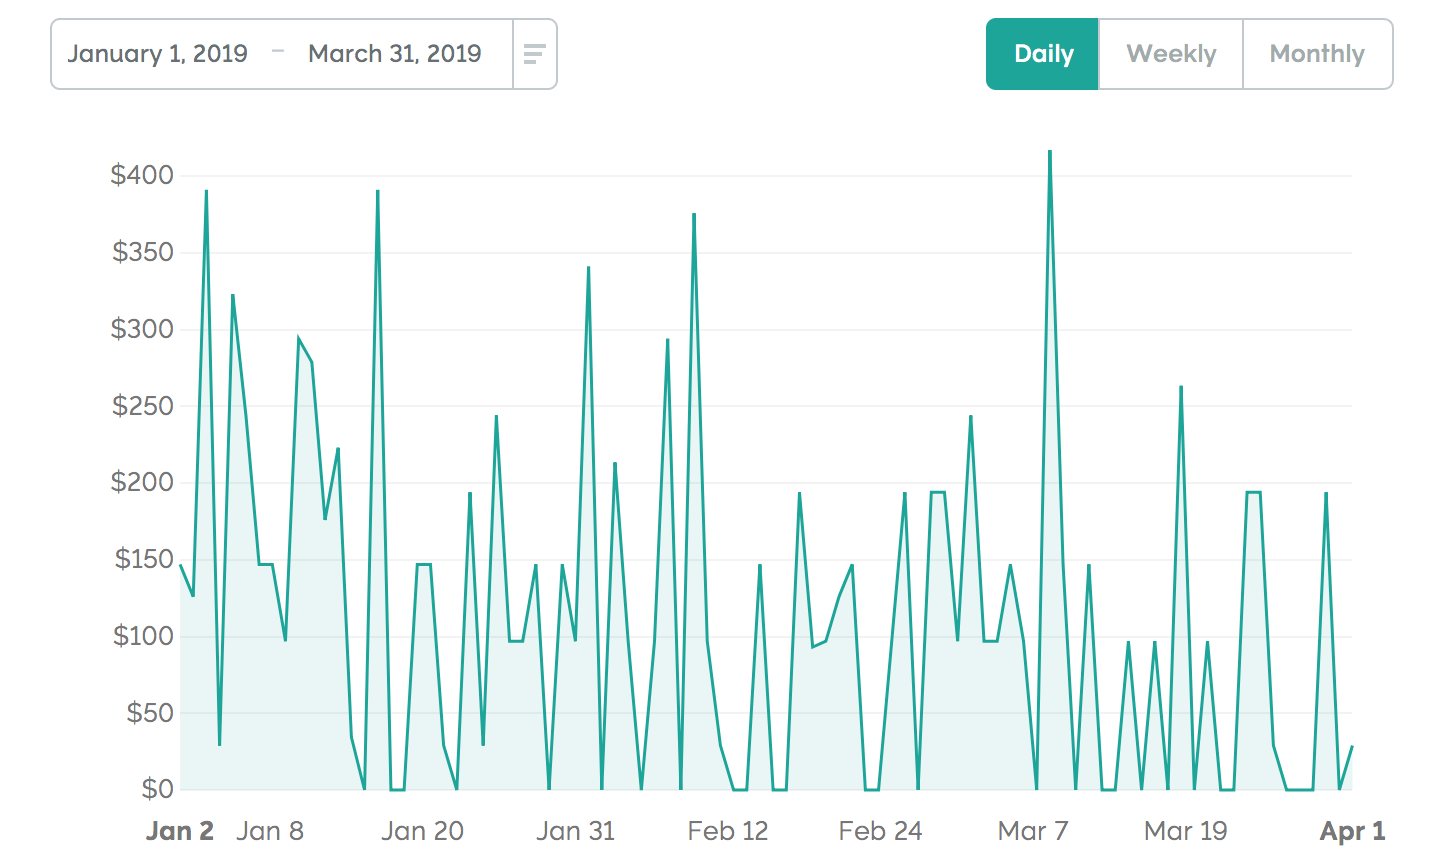
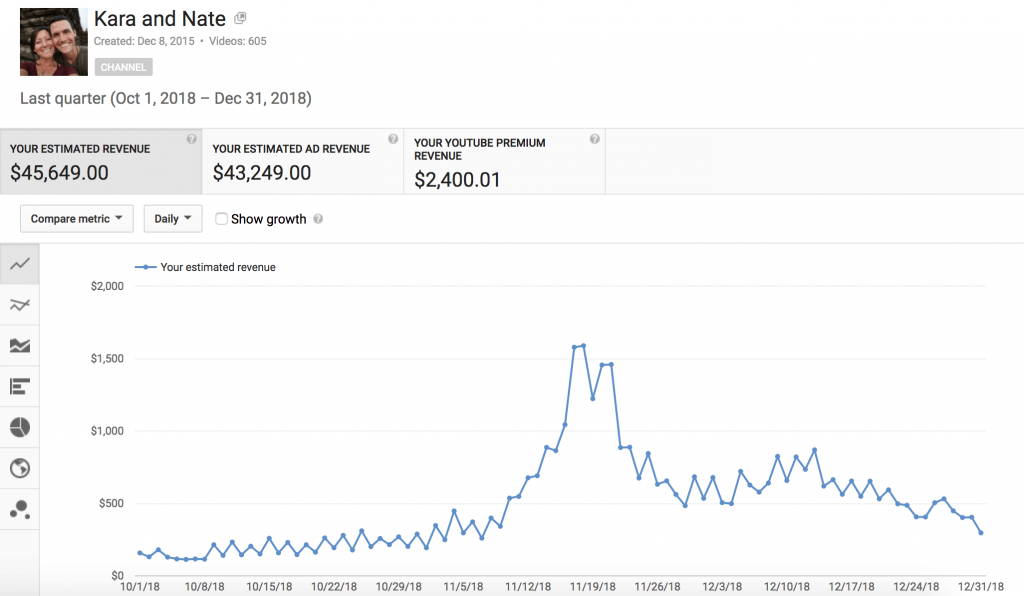
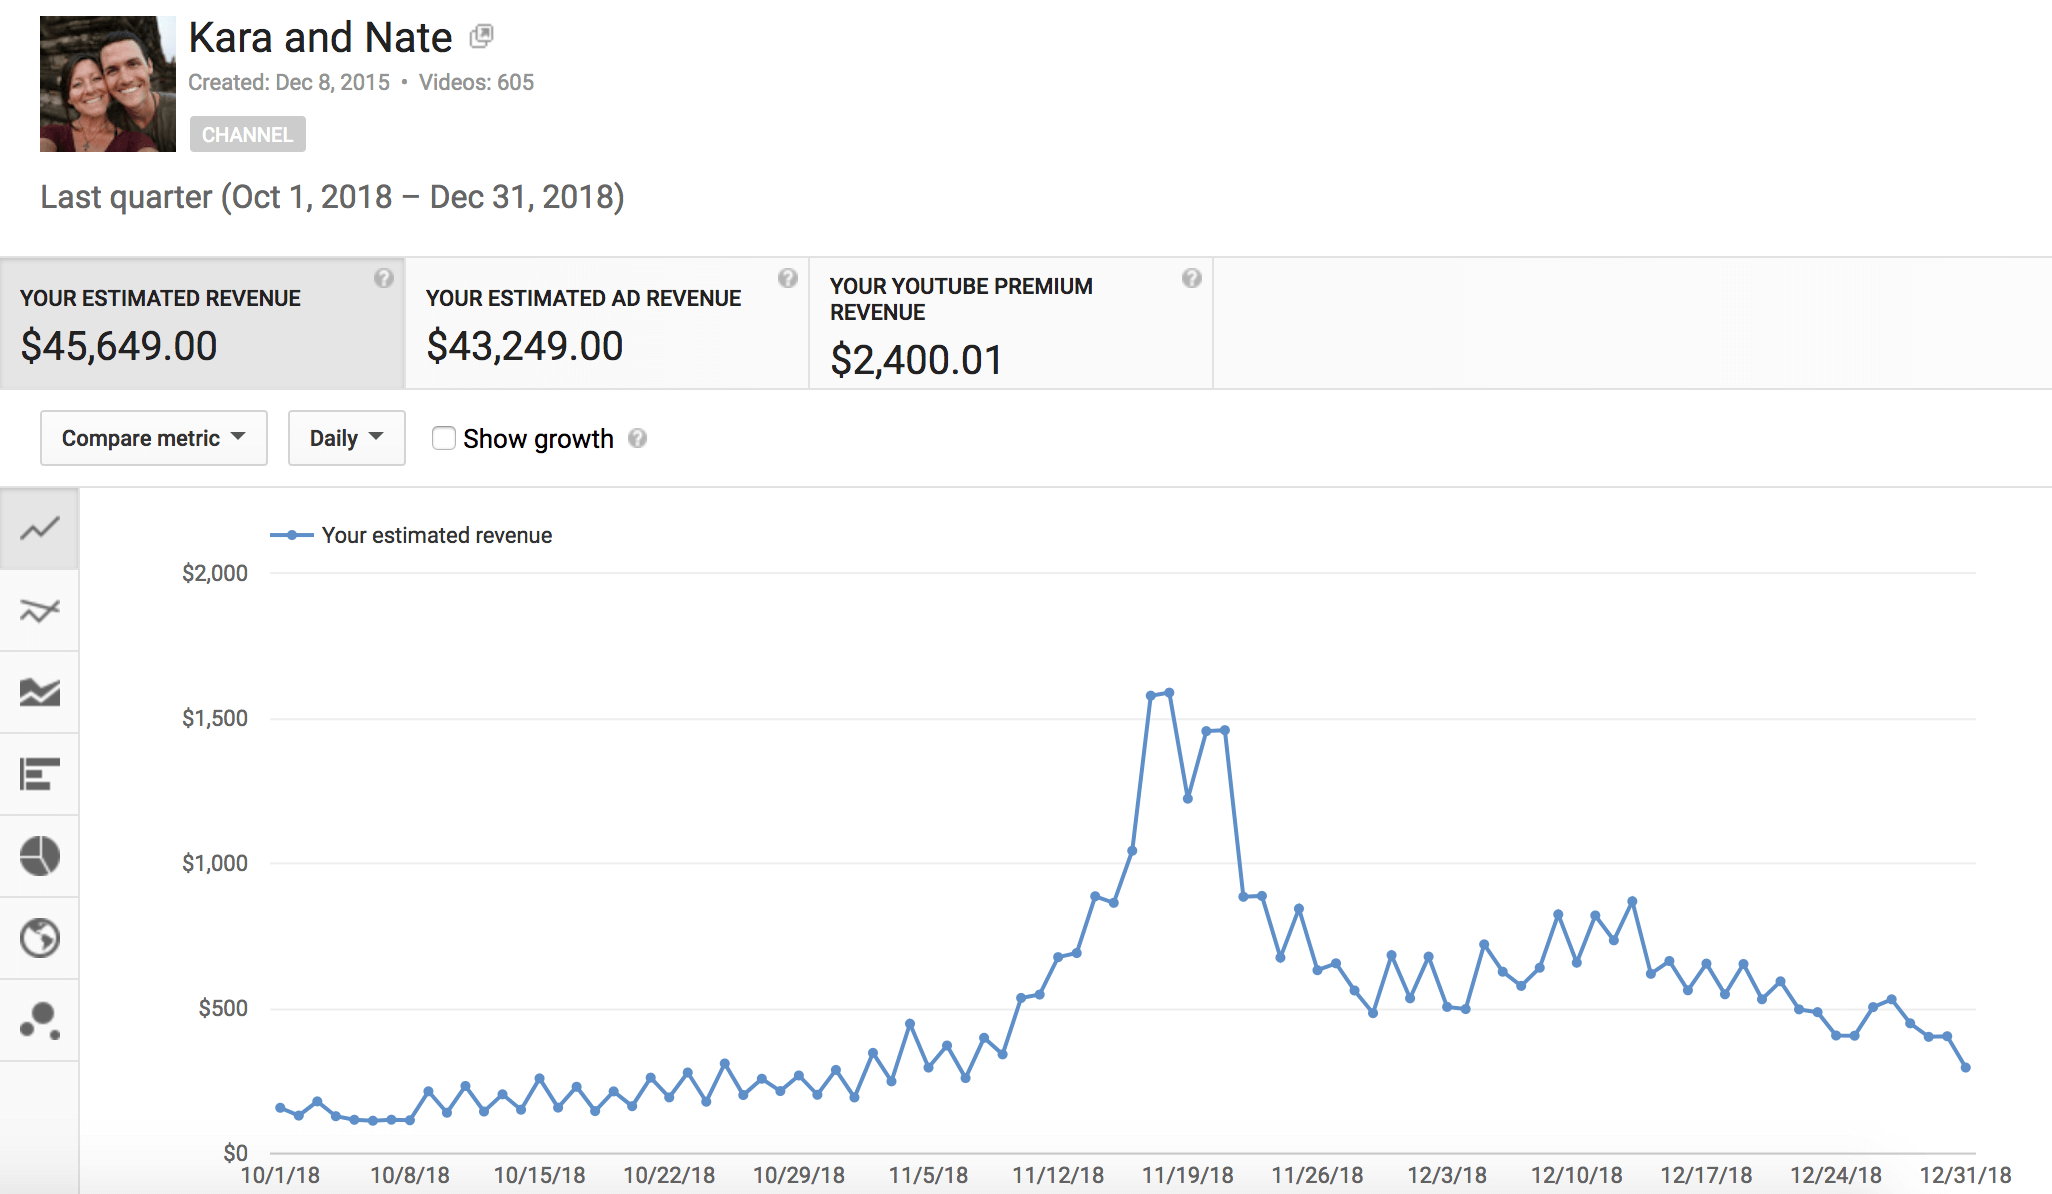
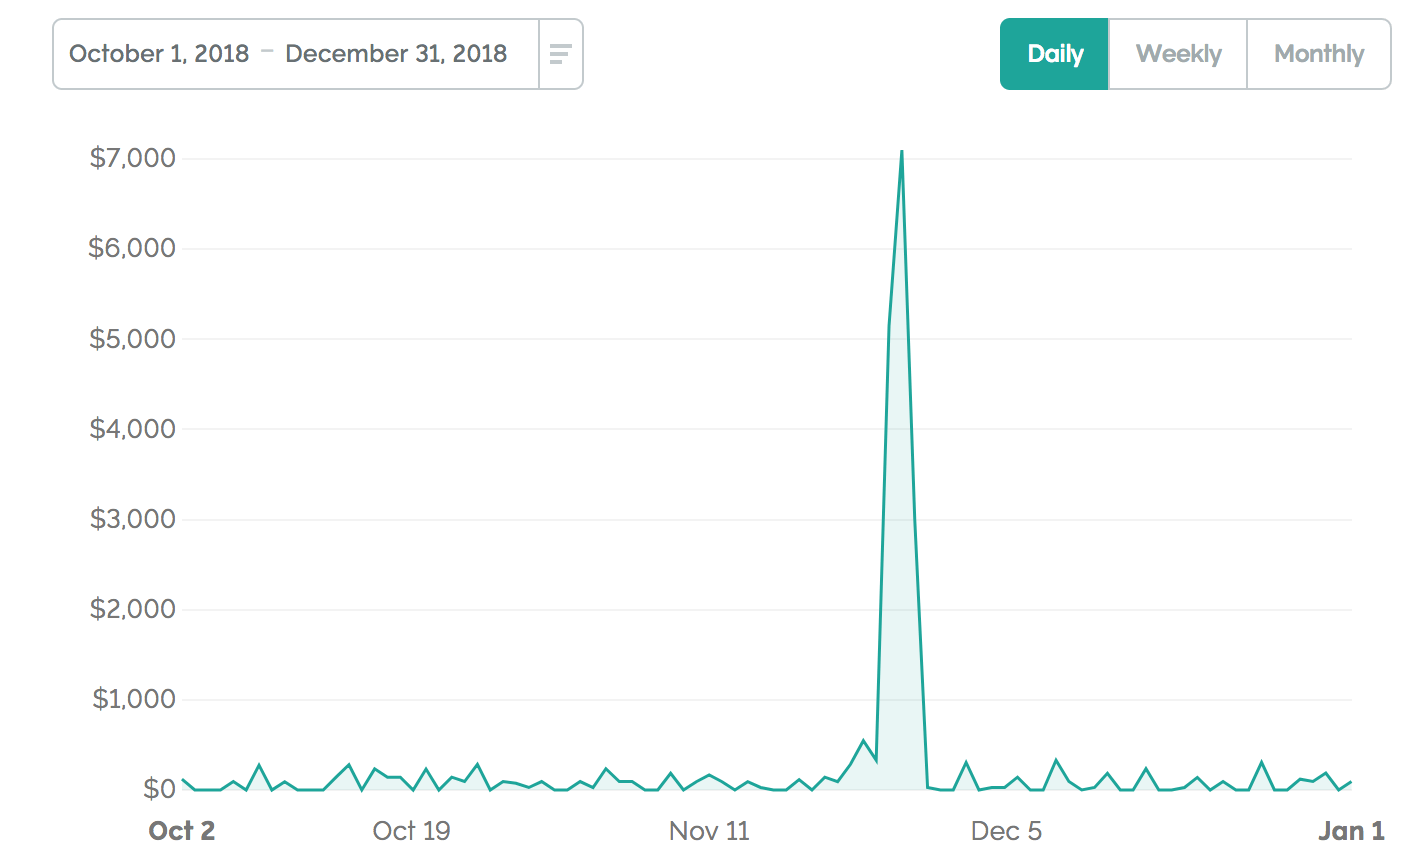
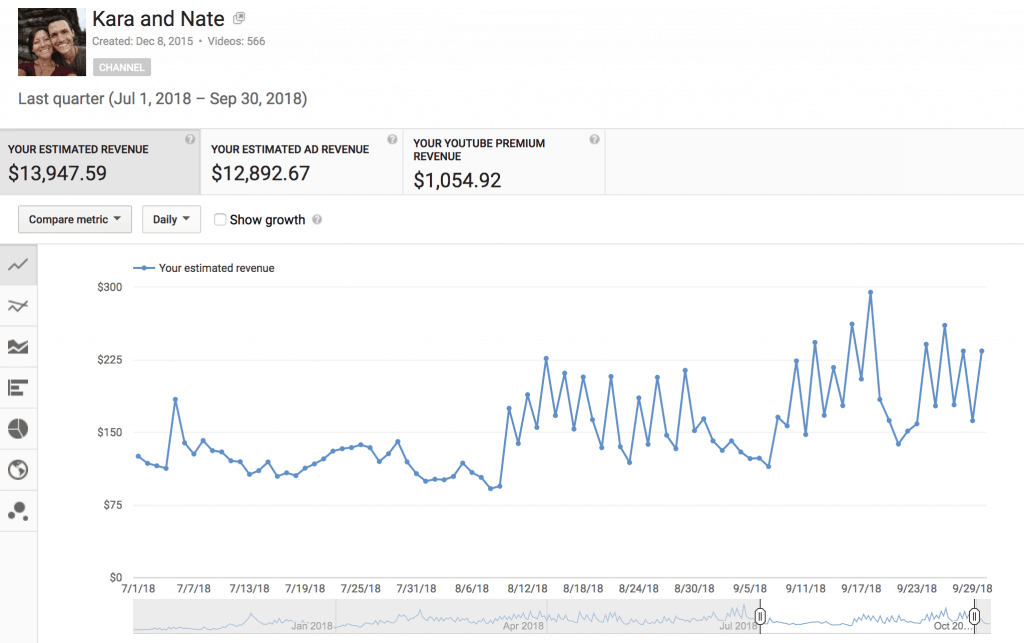
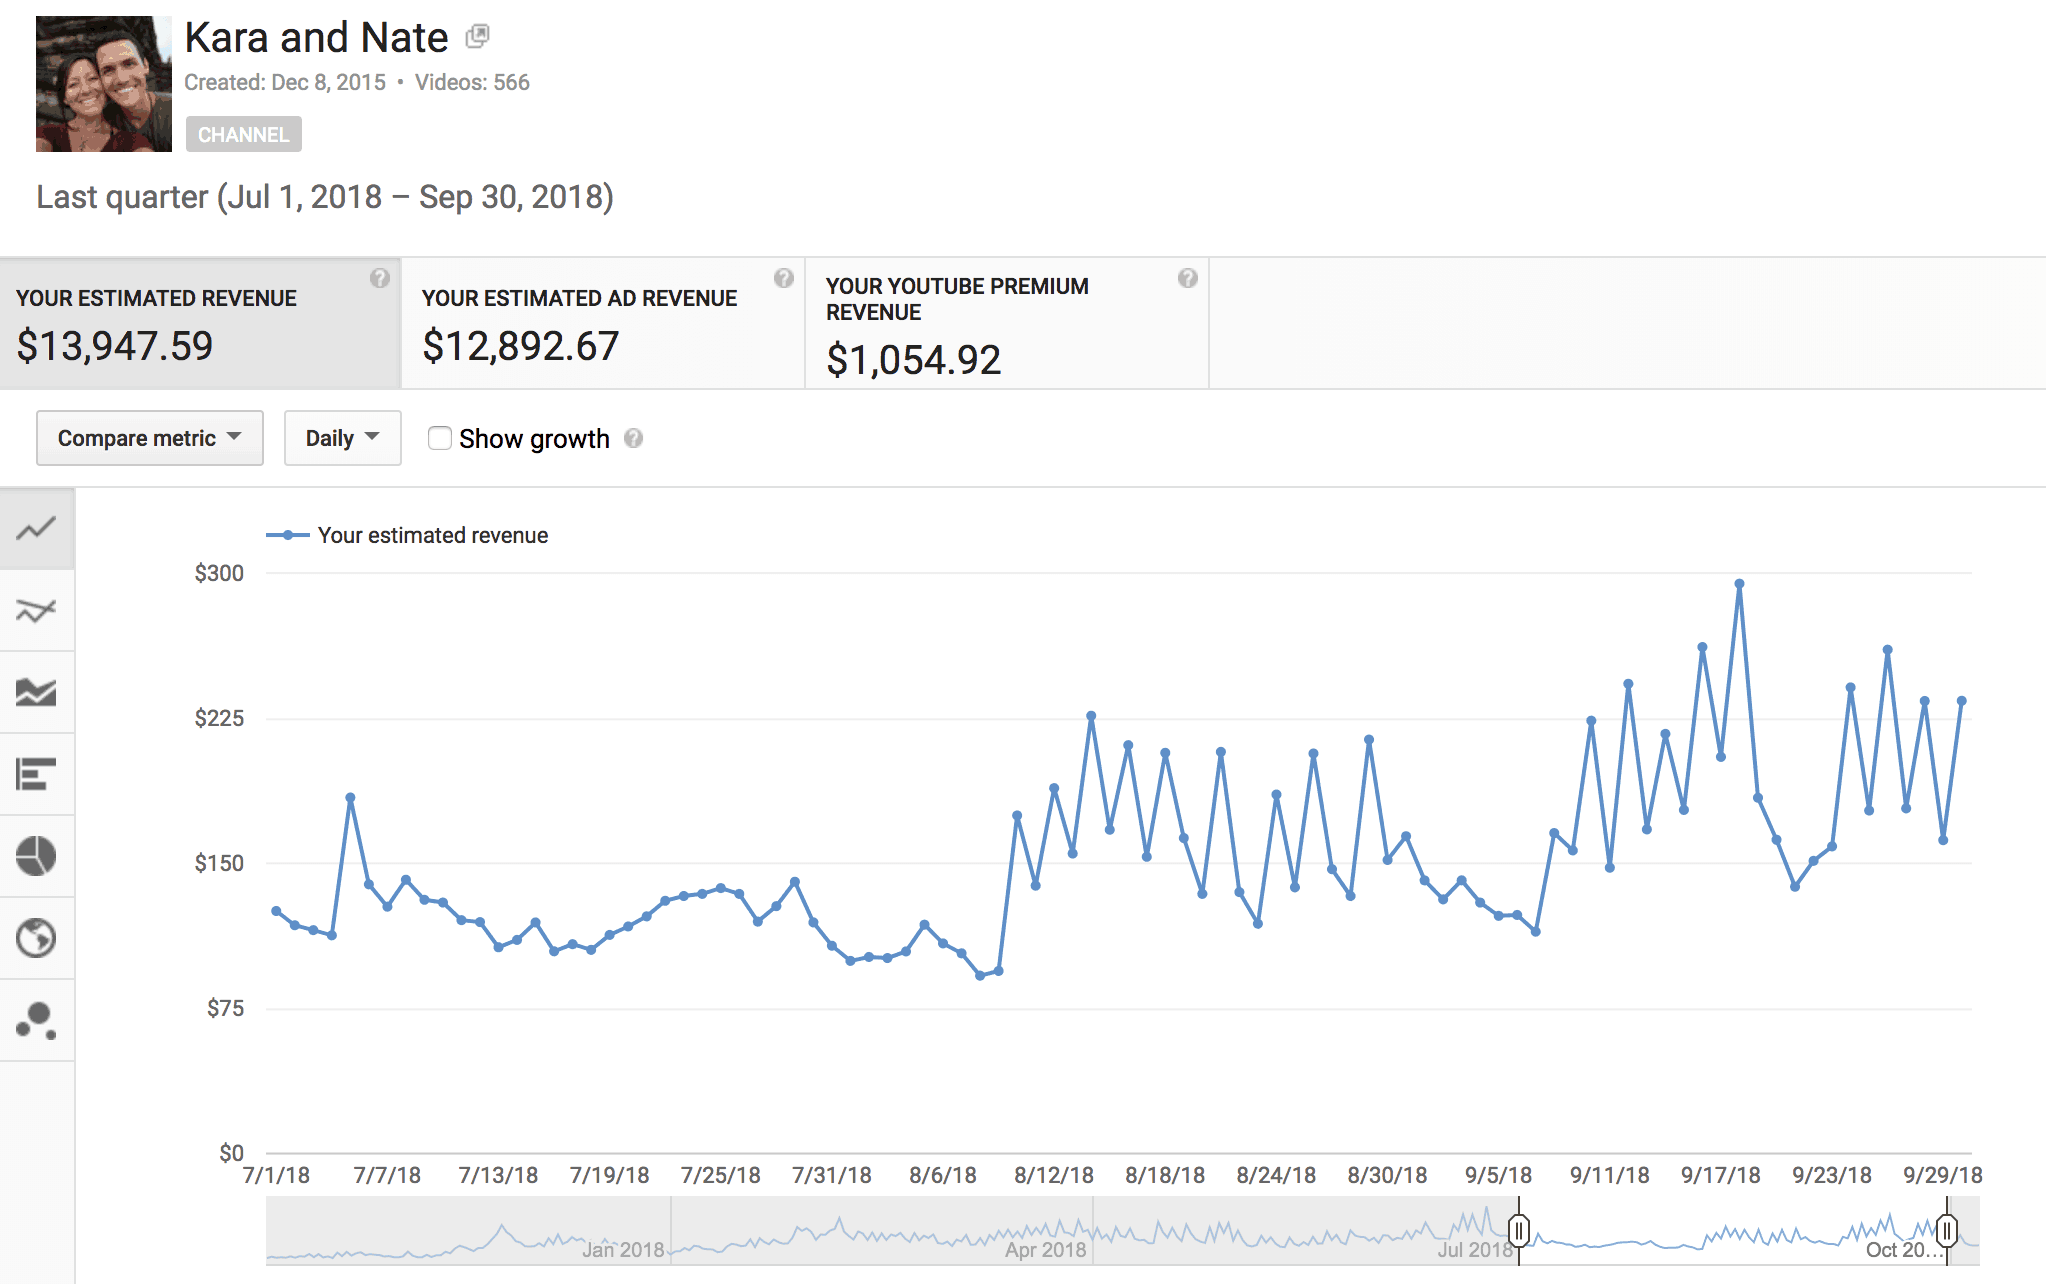
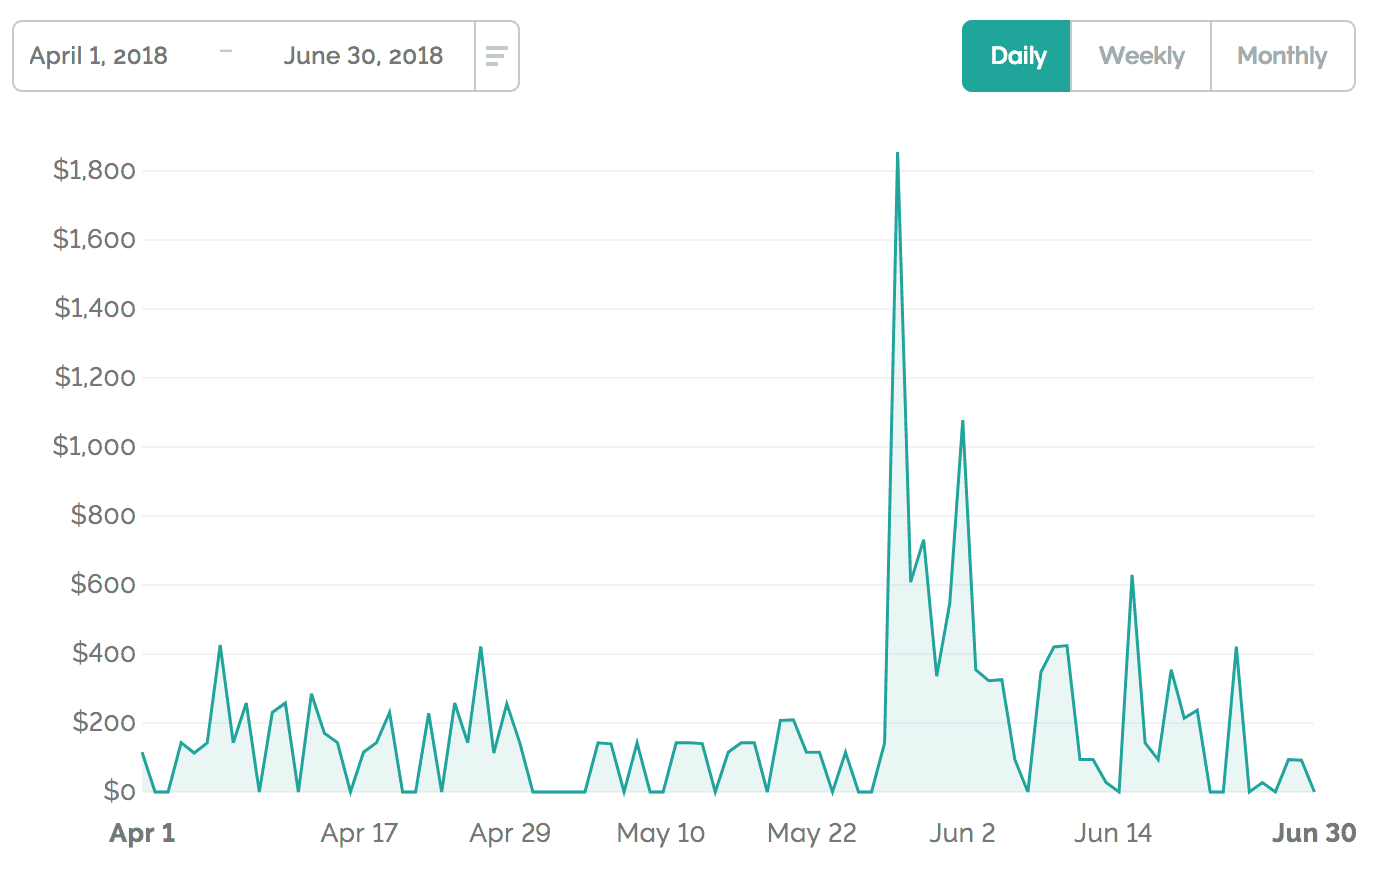
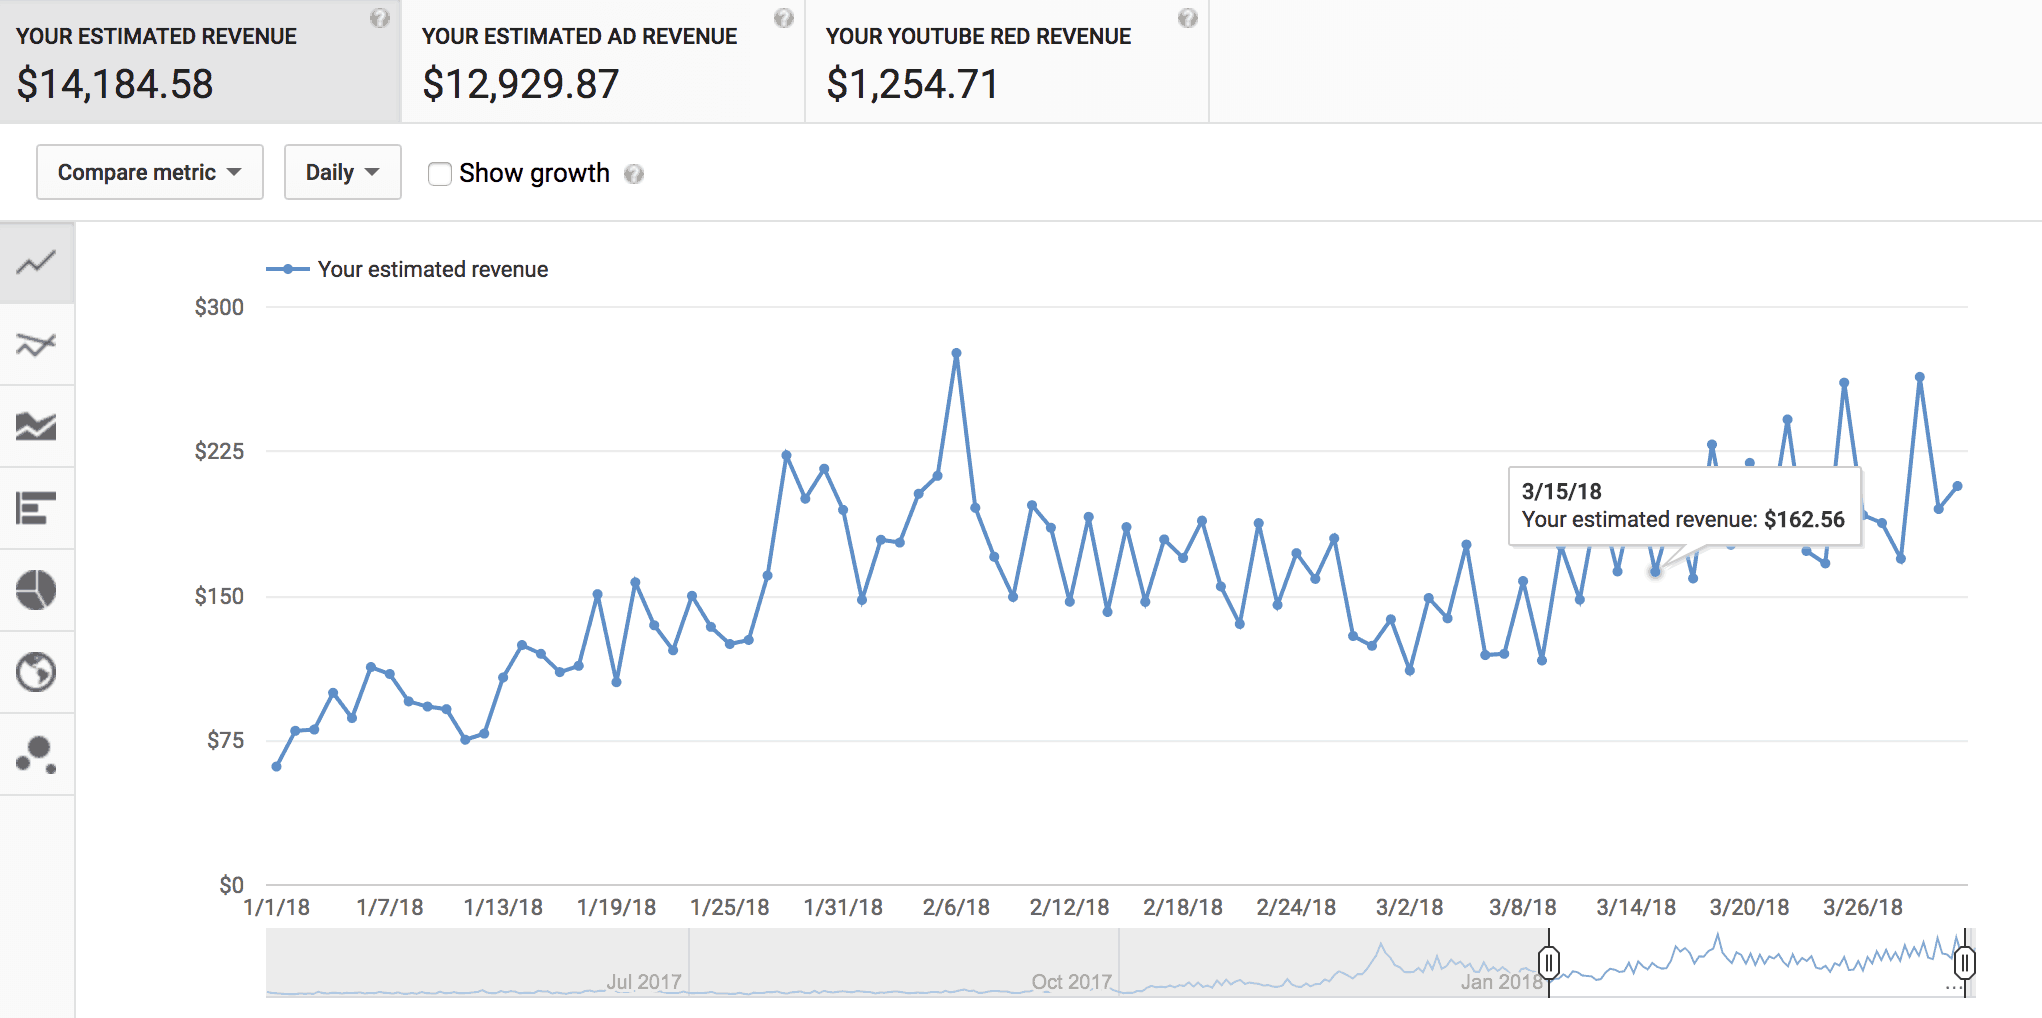
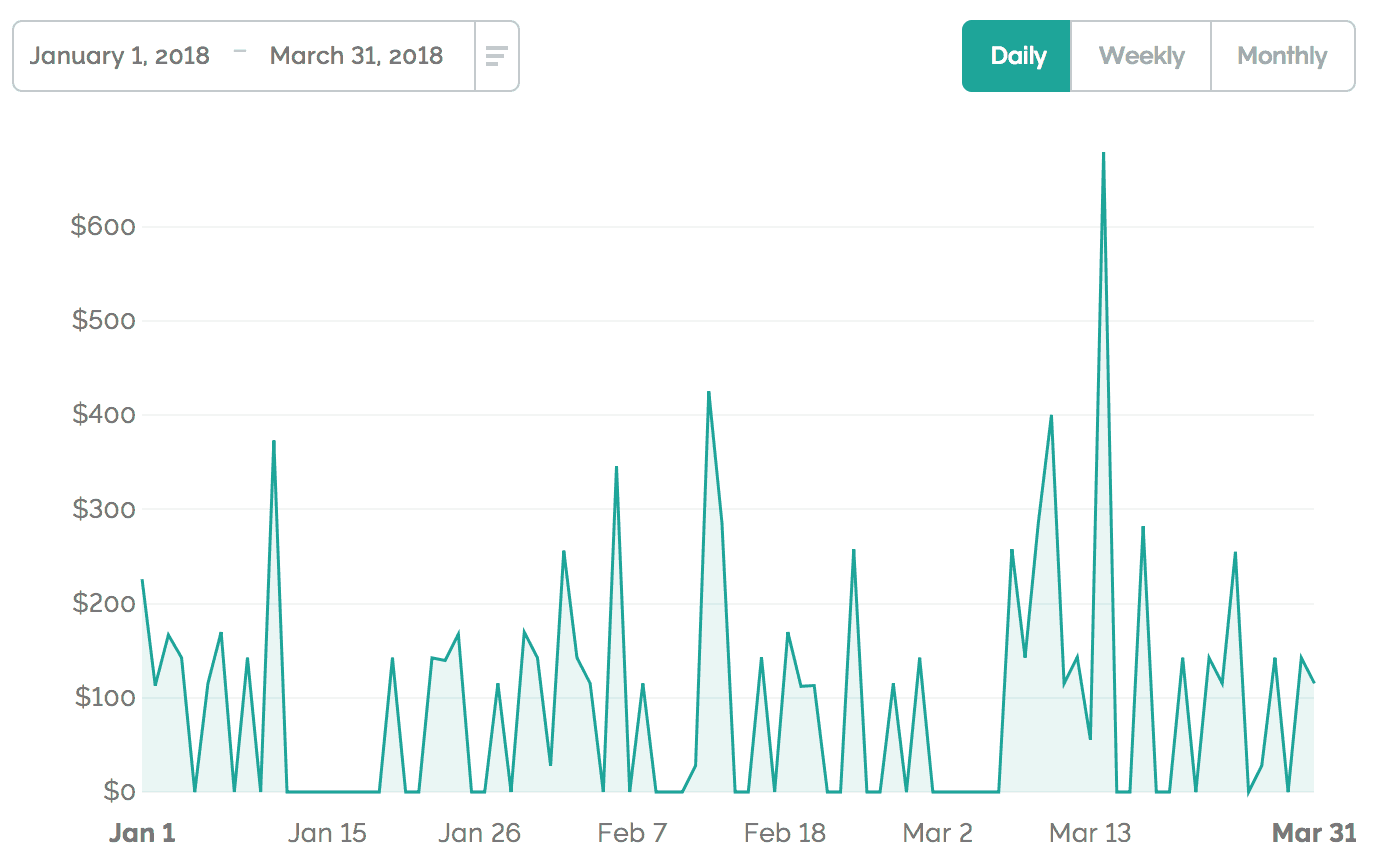
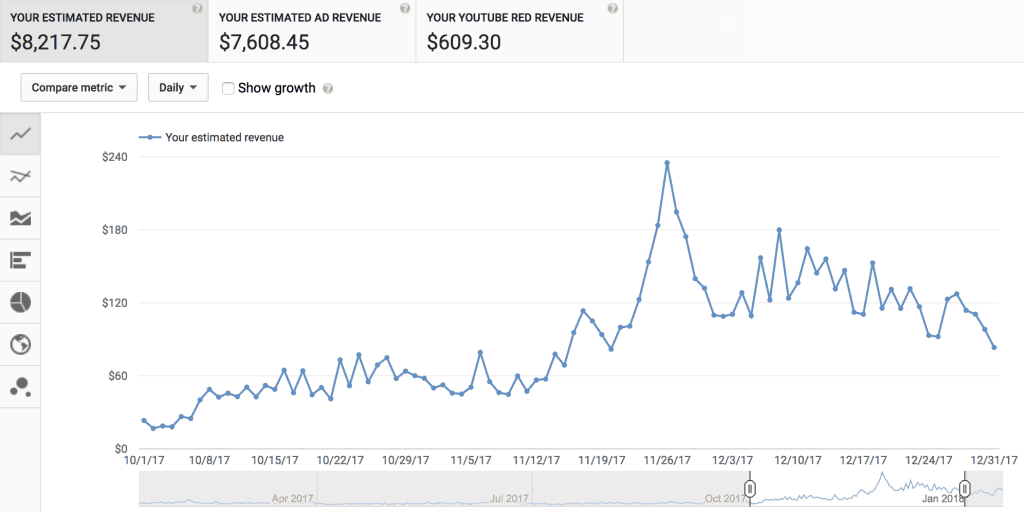
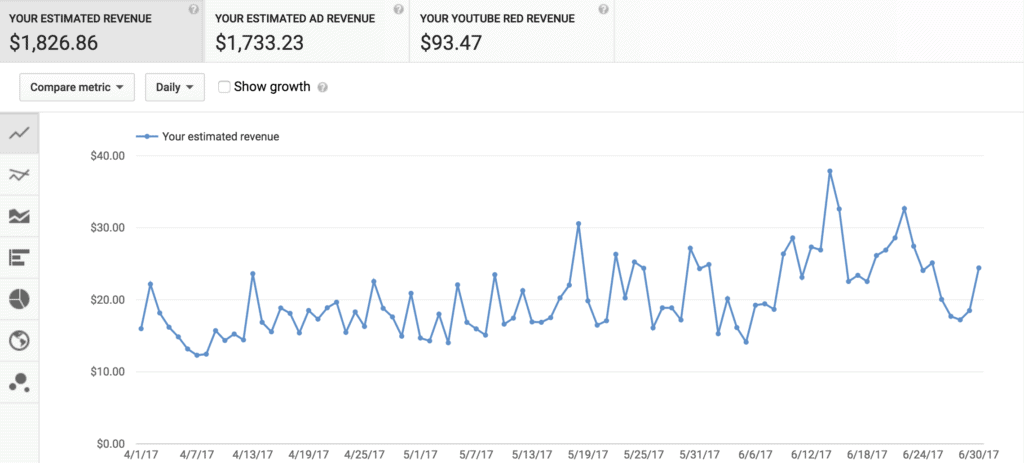
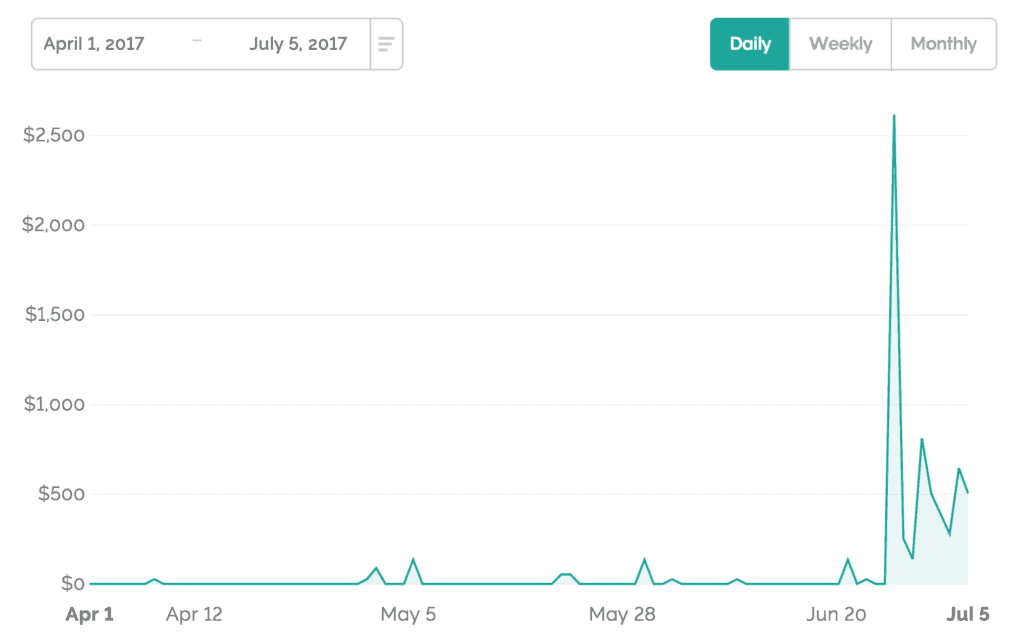
As you can see in the image below, the video has now been up for almost 2 months, and we’ve made almost $3,000 in ad revenue just from this video alone (which is awesome).
However, because this video attracted new people to our channel who stuck around and watched more videos, our ad revenue for the quarter increased by almost $15,000!
I think we secretly hope every video we upload will hit 1 million views in a week, but the reality is, it rarely happens. And for the most part, it’s out of our control. So, having this video do so well this quarter was a great surprise!
2. Patreon & PayPal – $10,748.52 (Change from Q2 -$215.33)
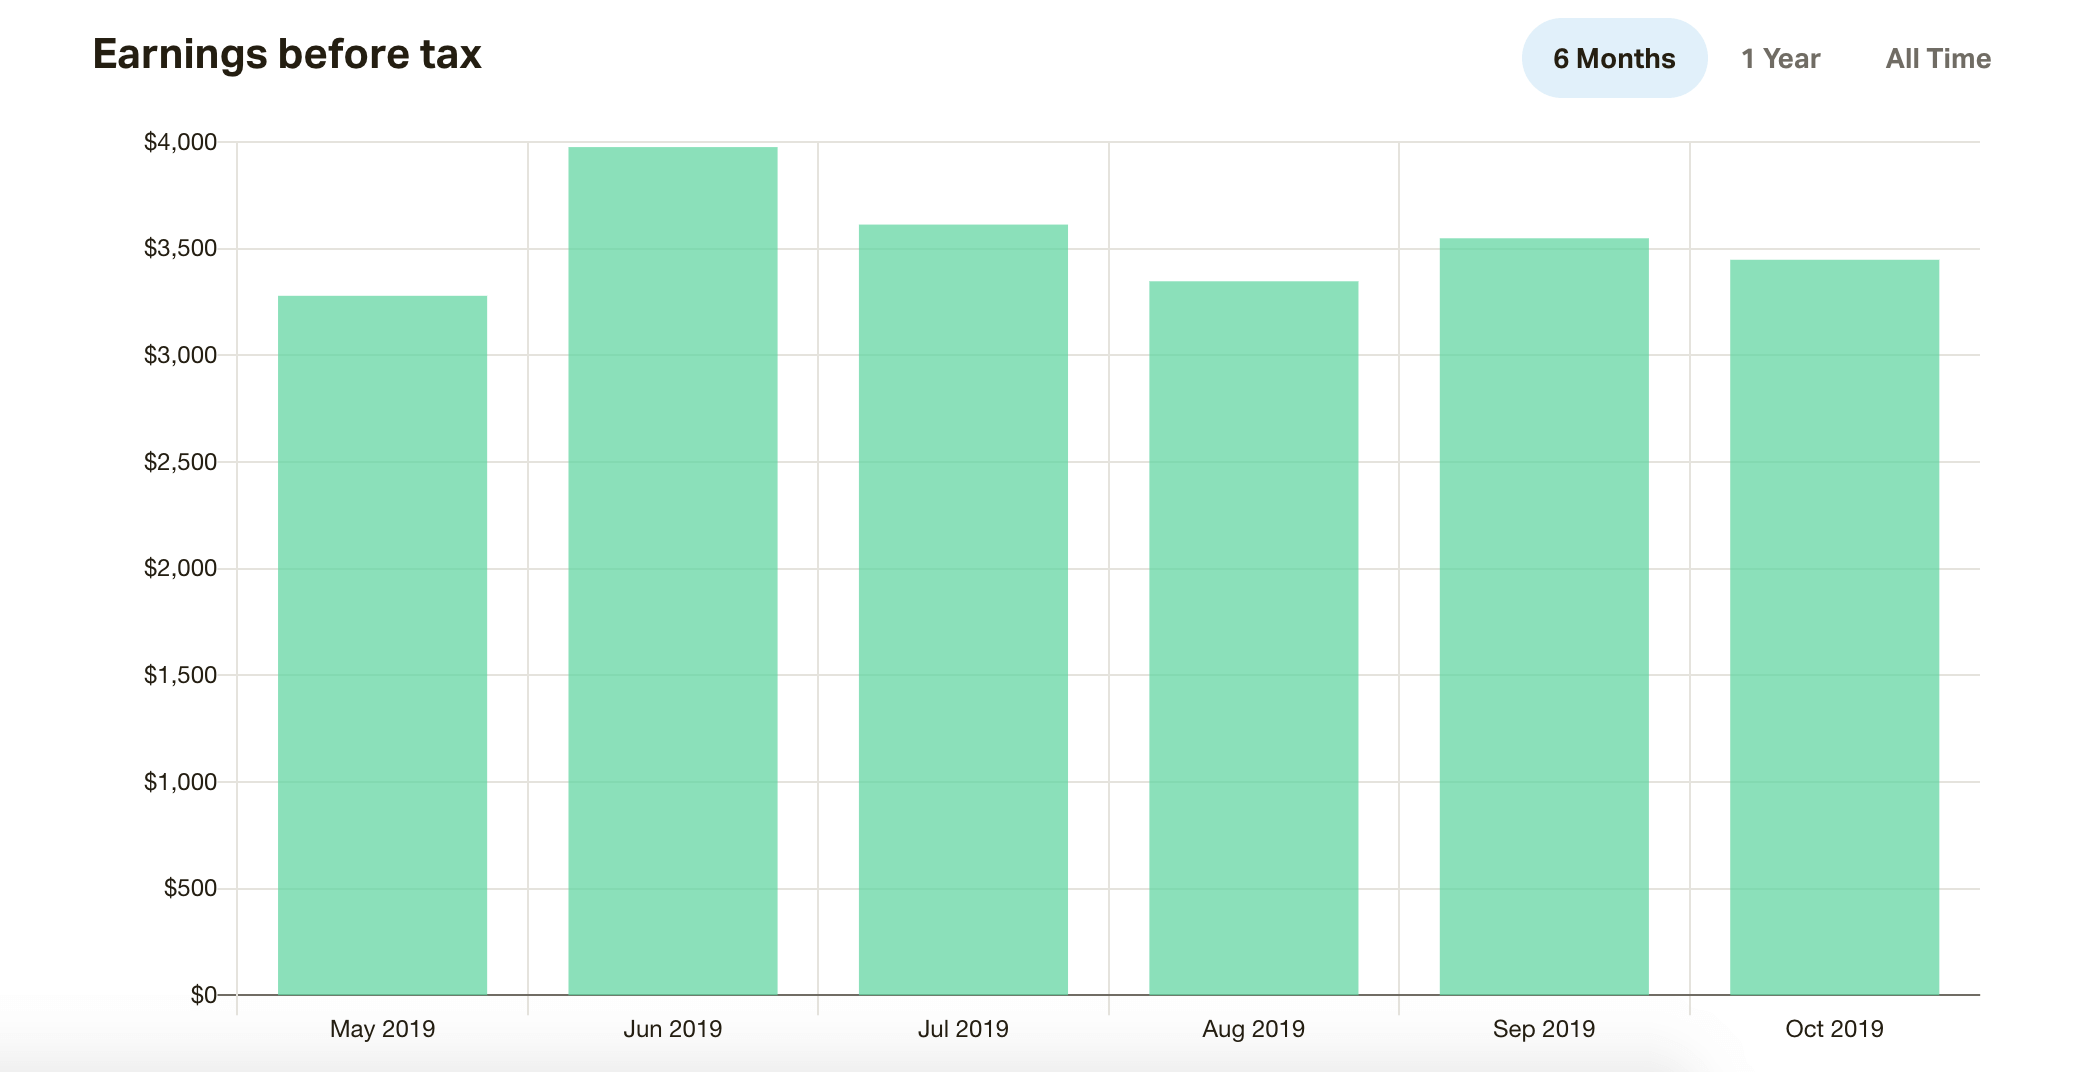
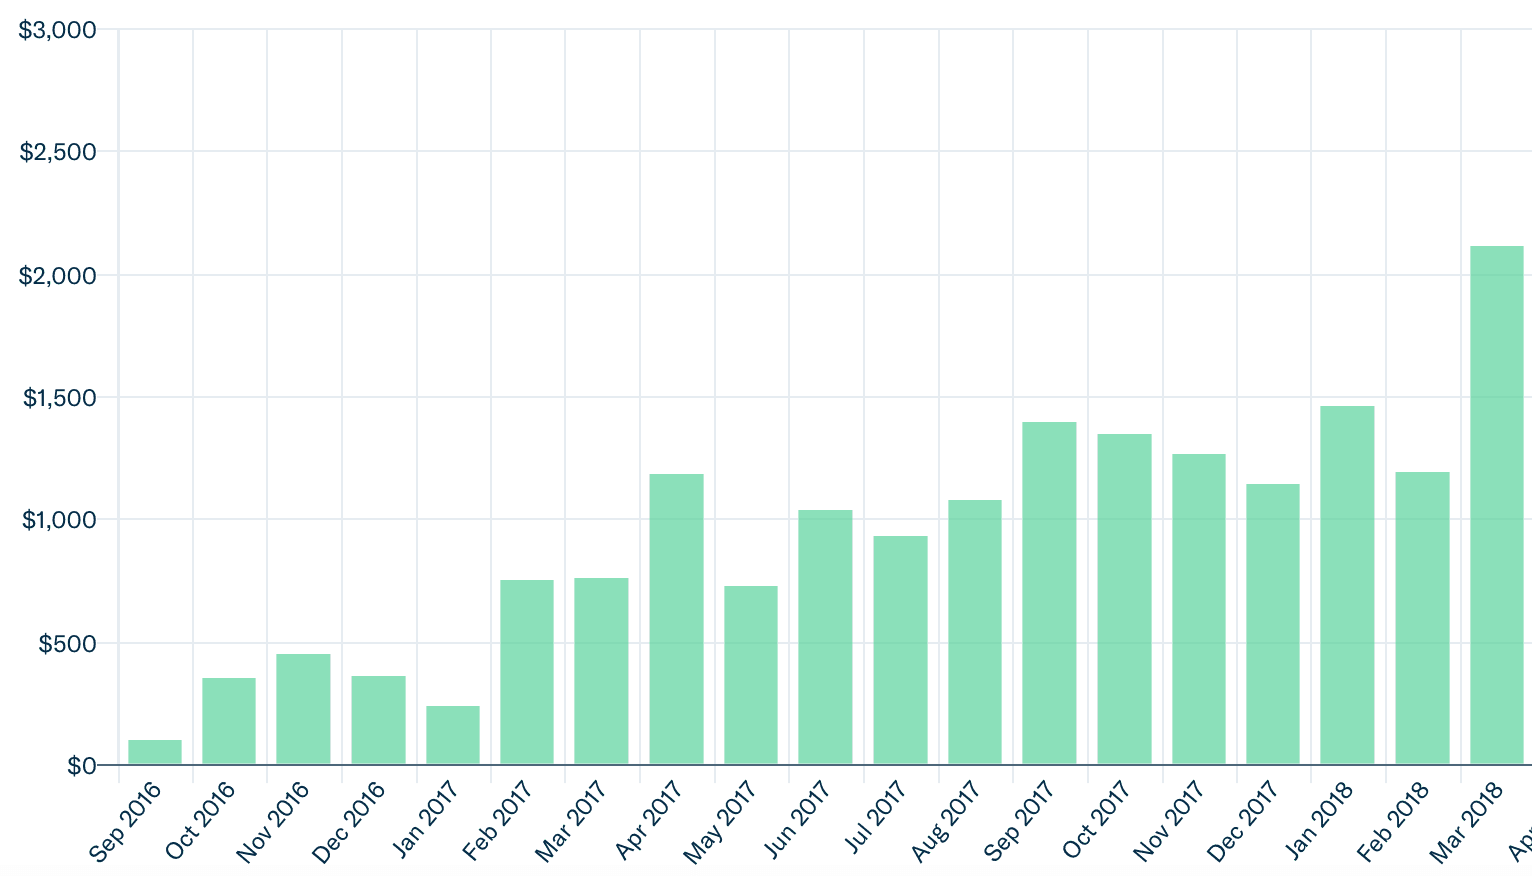
It can be scary to build a business on top of a platform that you don’t own (especially in the beginning). If you read the section above, you can see how much control YouTube has over our monthly ad revenue. This month, we were blessed by the algorithm, but it could just as quickly go in the other direction.
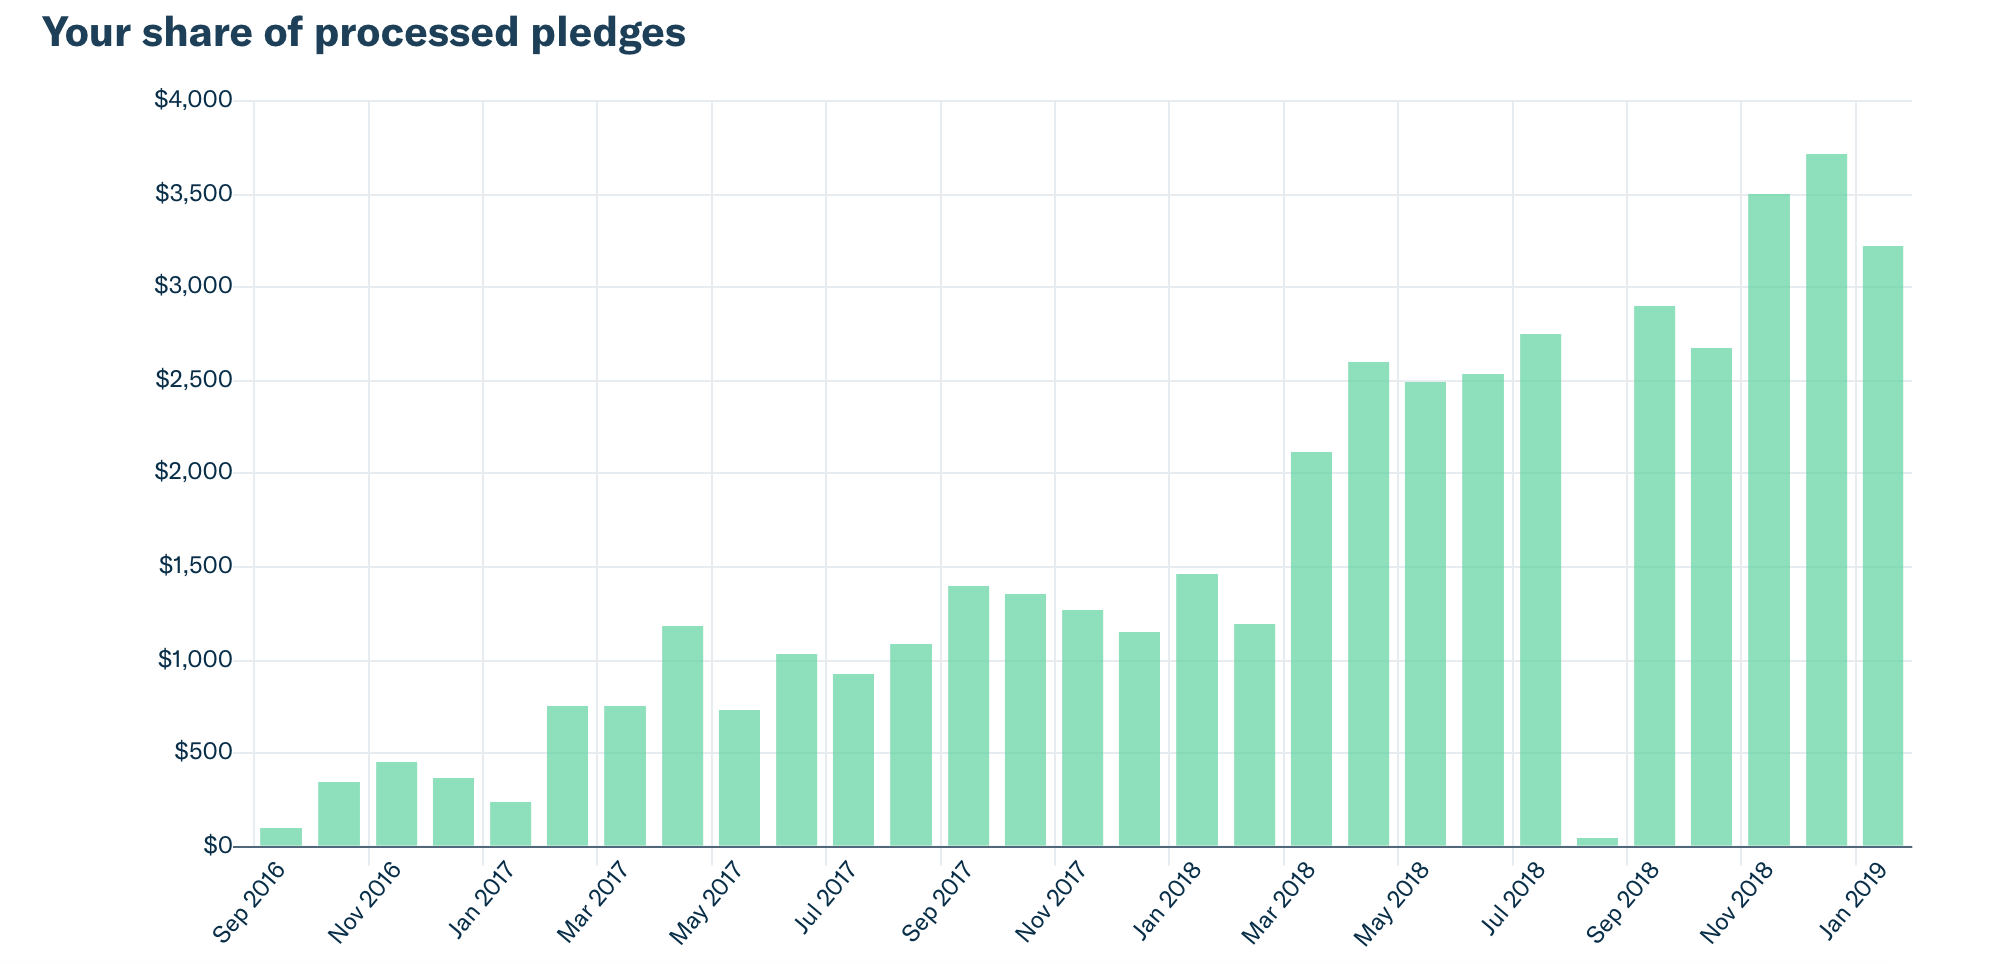
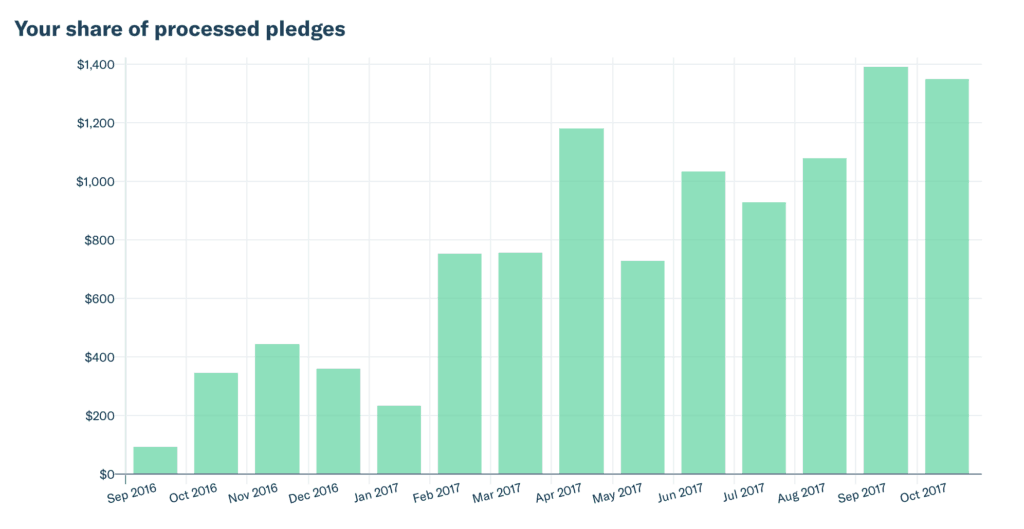
So much of our success/failure is tied to the growth of our YouTube channel, and we have very little control over that growth. This is why we’re so grateful for our patrons! Thanks to their support, we know that no matter what YouTube decides, this is one consistent source of income that we can count on every month!
For those of you who aren’t familiar with Patreon, it’s an online platform that allows you to support the work of your favorite creators giving them a chance to continue working on their creations without having to worry about where their next meal is going to come from!
CLICK HERE to learn more about becoming a patron!
3. Course Sales – $8,889.00 (Change from Q2 +$684)
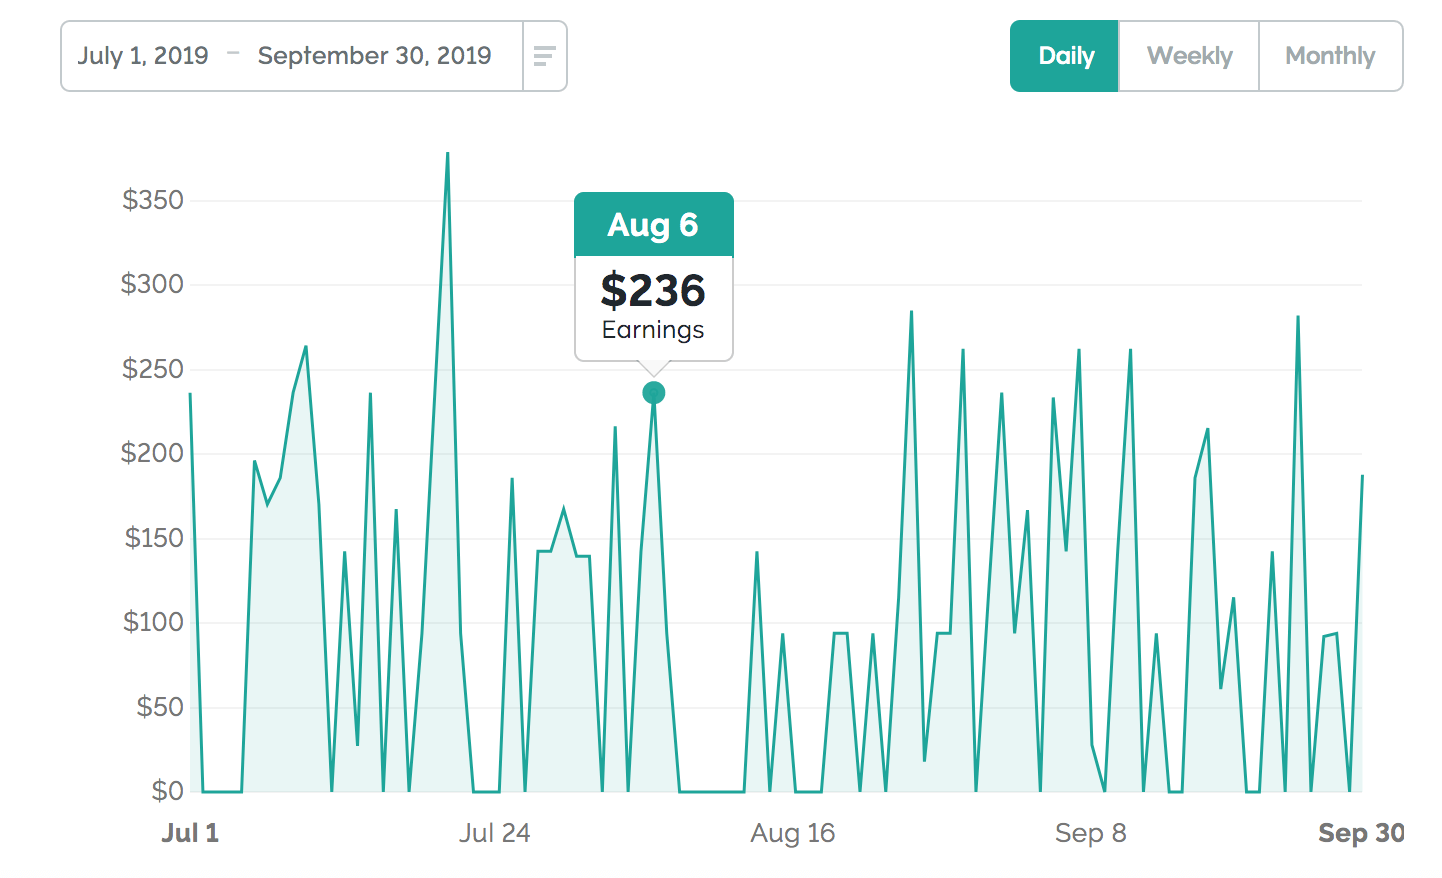
We’ve each created a course to teach others the subjects where we have the most expertise. For me, that’s travel hacking, and for Kara, it’s video editing. These took a ton of upfront work to create, but they have continued to be a great source of passive income over the last couple of years even with very little promotion. If you don’t know what online courses I’m talking about…
- 30 Days to Becoming a Travel hacker is a course I created to teach others the strategies I use to save thousands of dollars on flights and hotels.
- Kara’s Behind the Scenes Guide to Creating a Vlog is the course Kara created to let you watch over her shoulder and learn the exact methods she uses to create one of our travel vlogs.
4. Affiliate Income – $28,642.53 (Change from Q2 +$7,101.98)
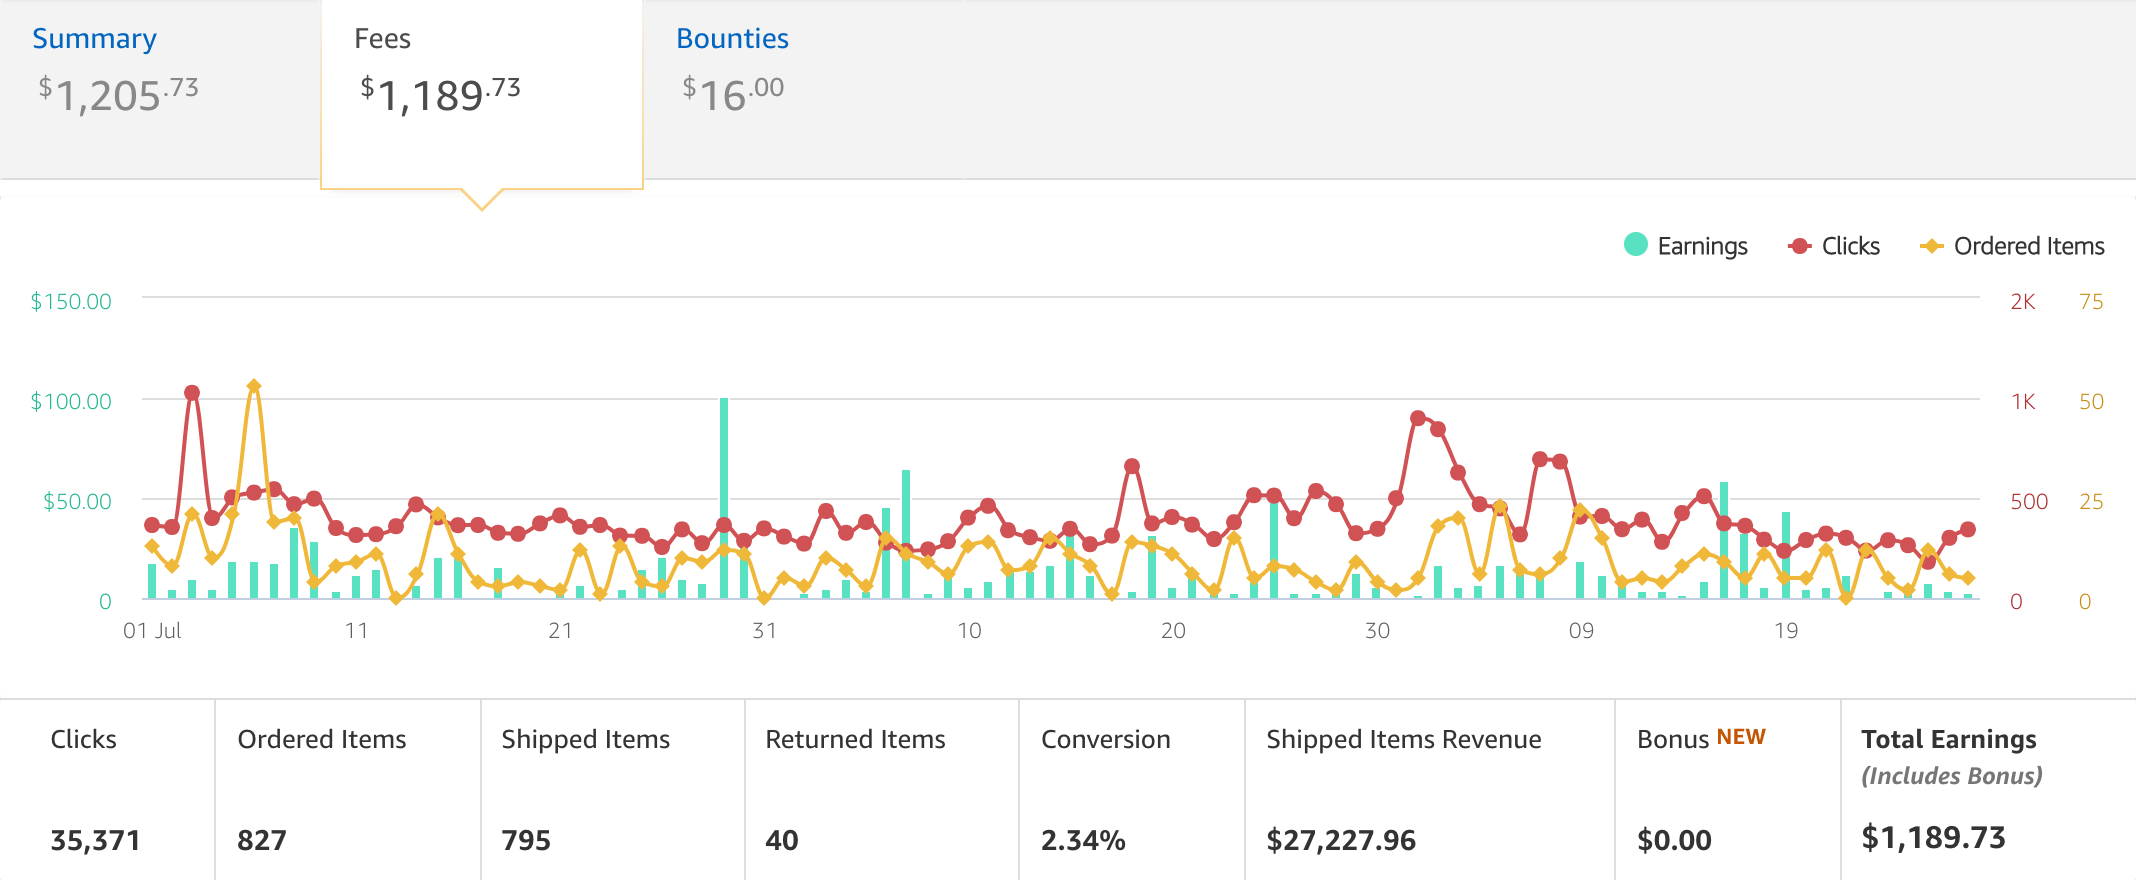
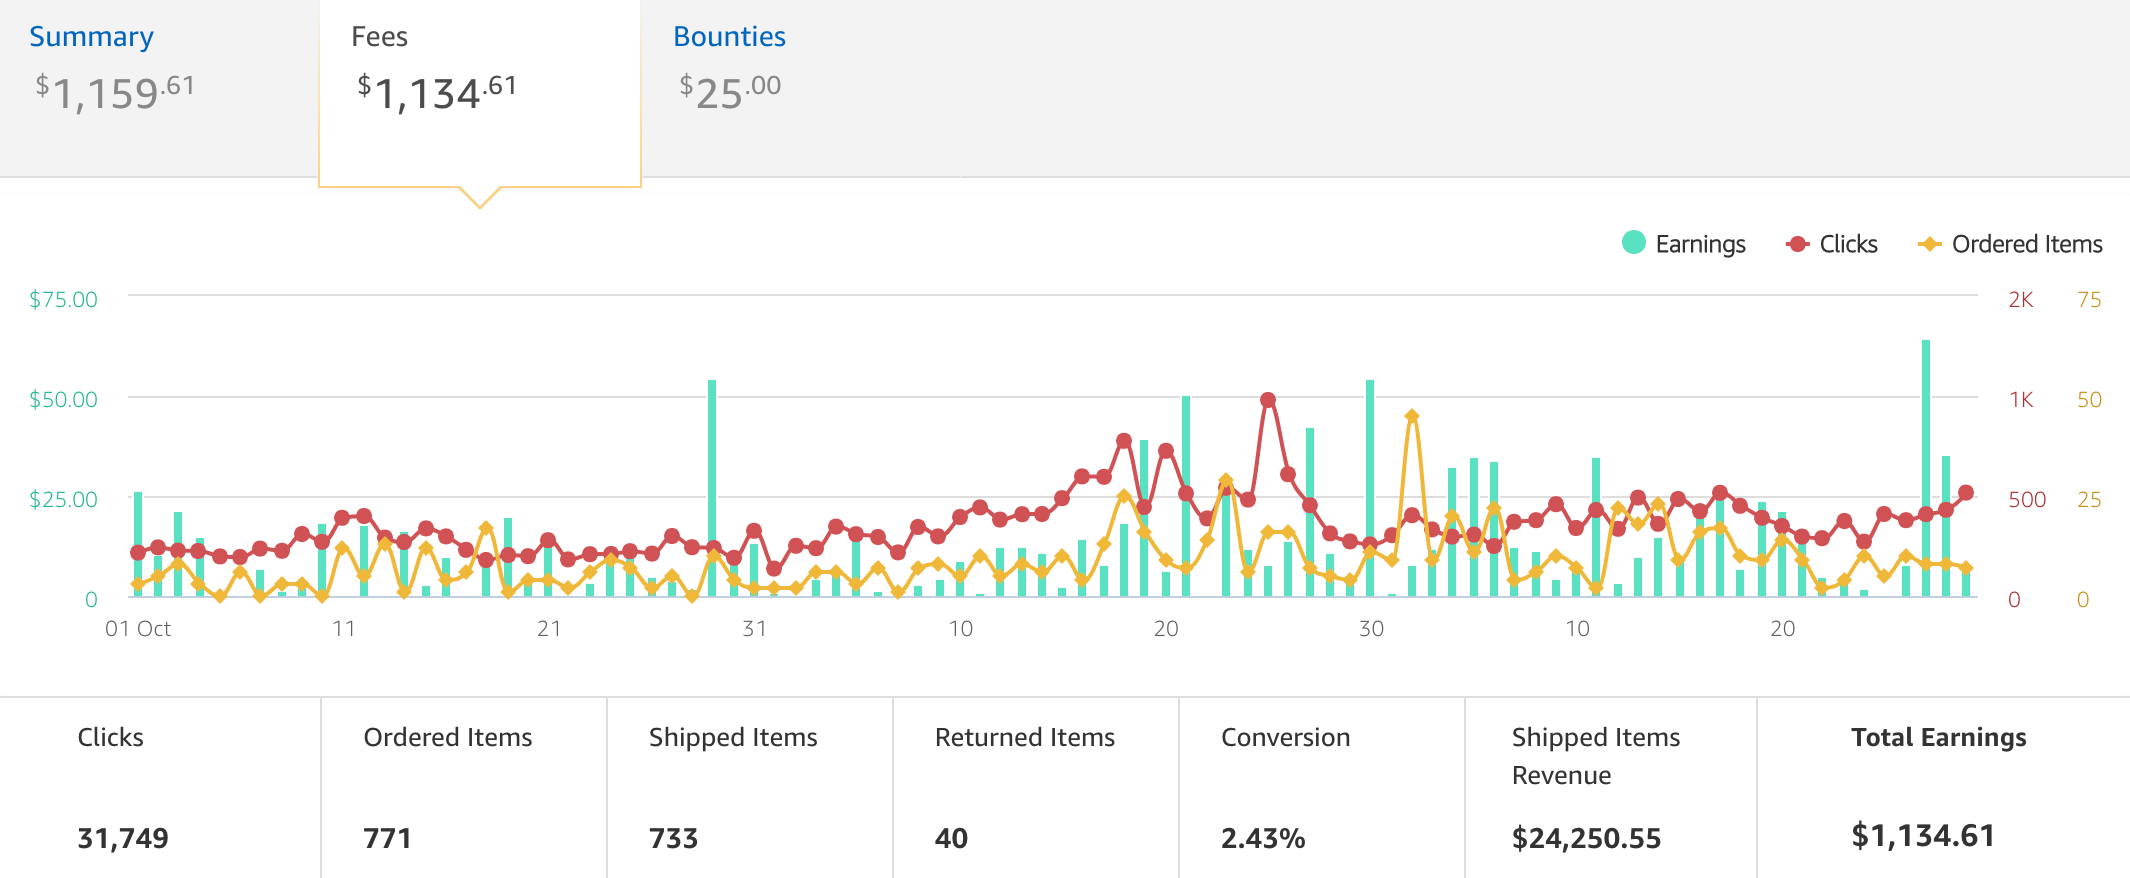
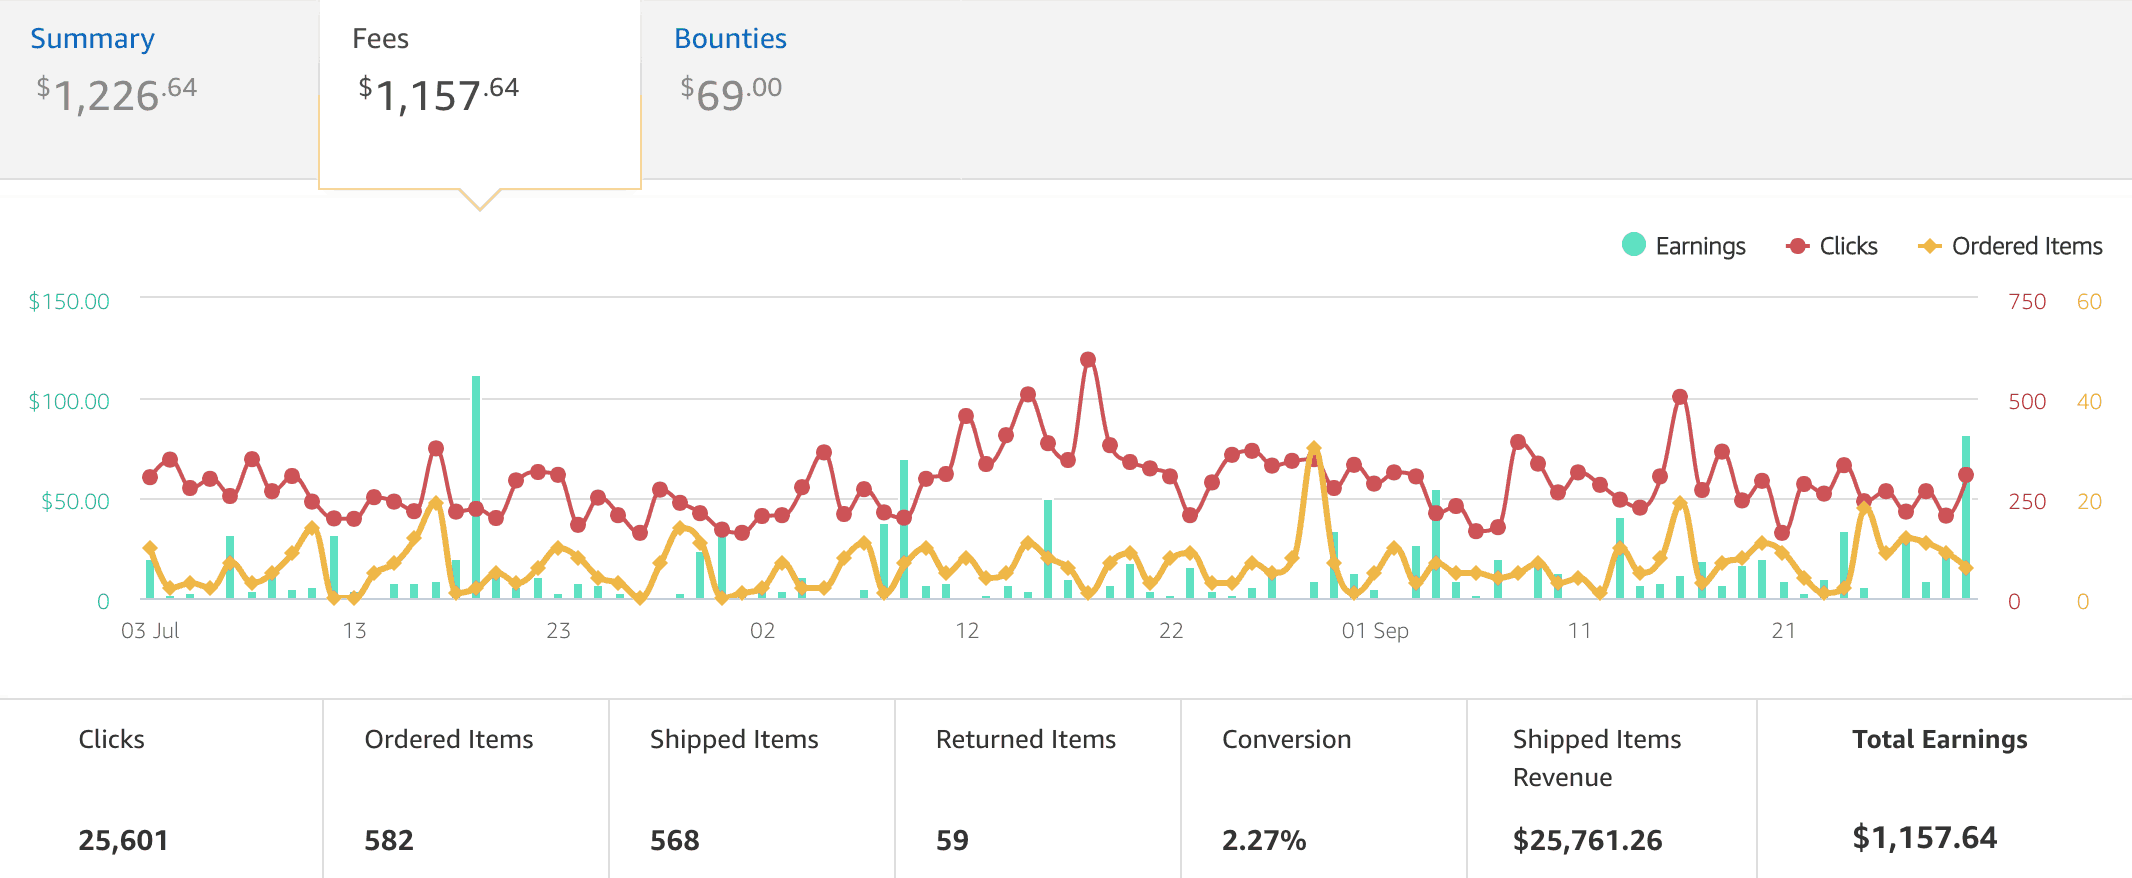
- Amazon – $1,266.30
- Epidemic Sound – $3,960
- Creditcards.com – $22,346
- Audible – $105
- ConvertKit – $71.10
- Adobe – $338.89
- TubeBuddy – $30.83
- TravelCon – $337.12
- Wandrd – $187.29
The majority of our affiliate income comes from the ongoing promotion of companies and products we love, such as banks with great travel credit cards, Epidemic Sound, and travel gear. It’s an awesome feeling to get rewarded for doing something we are already doing for free: recommending products we use and love.
This quarter, we saw a substantial increase in our affiliate income. We didn’t do anything differently this month, but the channel growth we experienced led to more people checking out affiliate links which ultimately generated more commissions.
The major driver of our affiliate income this year has been credit card referrals. The data we receive around these referrals isn’t very detailed, but I’m pretty sure the major driver of referrals is from our free credit card consultation service. This is where we help people find the best travel credit card(s) that will help them achieve their travel goals.
It is a manual and time consuming task to talk with each person about their specific situation and make sure we’re recommending the right card(s). So, it’s awesome that we’re able to offer this service for free thanks to the commissions we receive from the banks.
If you’d like help figuring out which travel credit card(s) to sign up for to maximize your rewards and savings, you can request a FREE consultation by clicking the button below!
Or you can check out our Top 10 Travel Credit Cards post that we update every month!
Our second-largest source of affiliate income is Epidemic Sound. We get all the music for our YouTube videos through this service. It’s hard to find good music for YouTube videos. Kara used to waste hours of her life searching for music, and now she has a huge library of royalty-free songs to choose from! She loves this service, promotes it at the end of all of our videos, and we get paid anytime someone signs up for a free trial.
If you need music for YouTube videos, click here to check out Epidemic Sound!
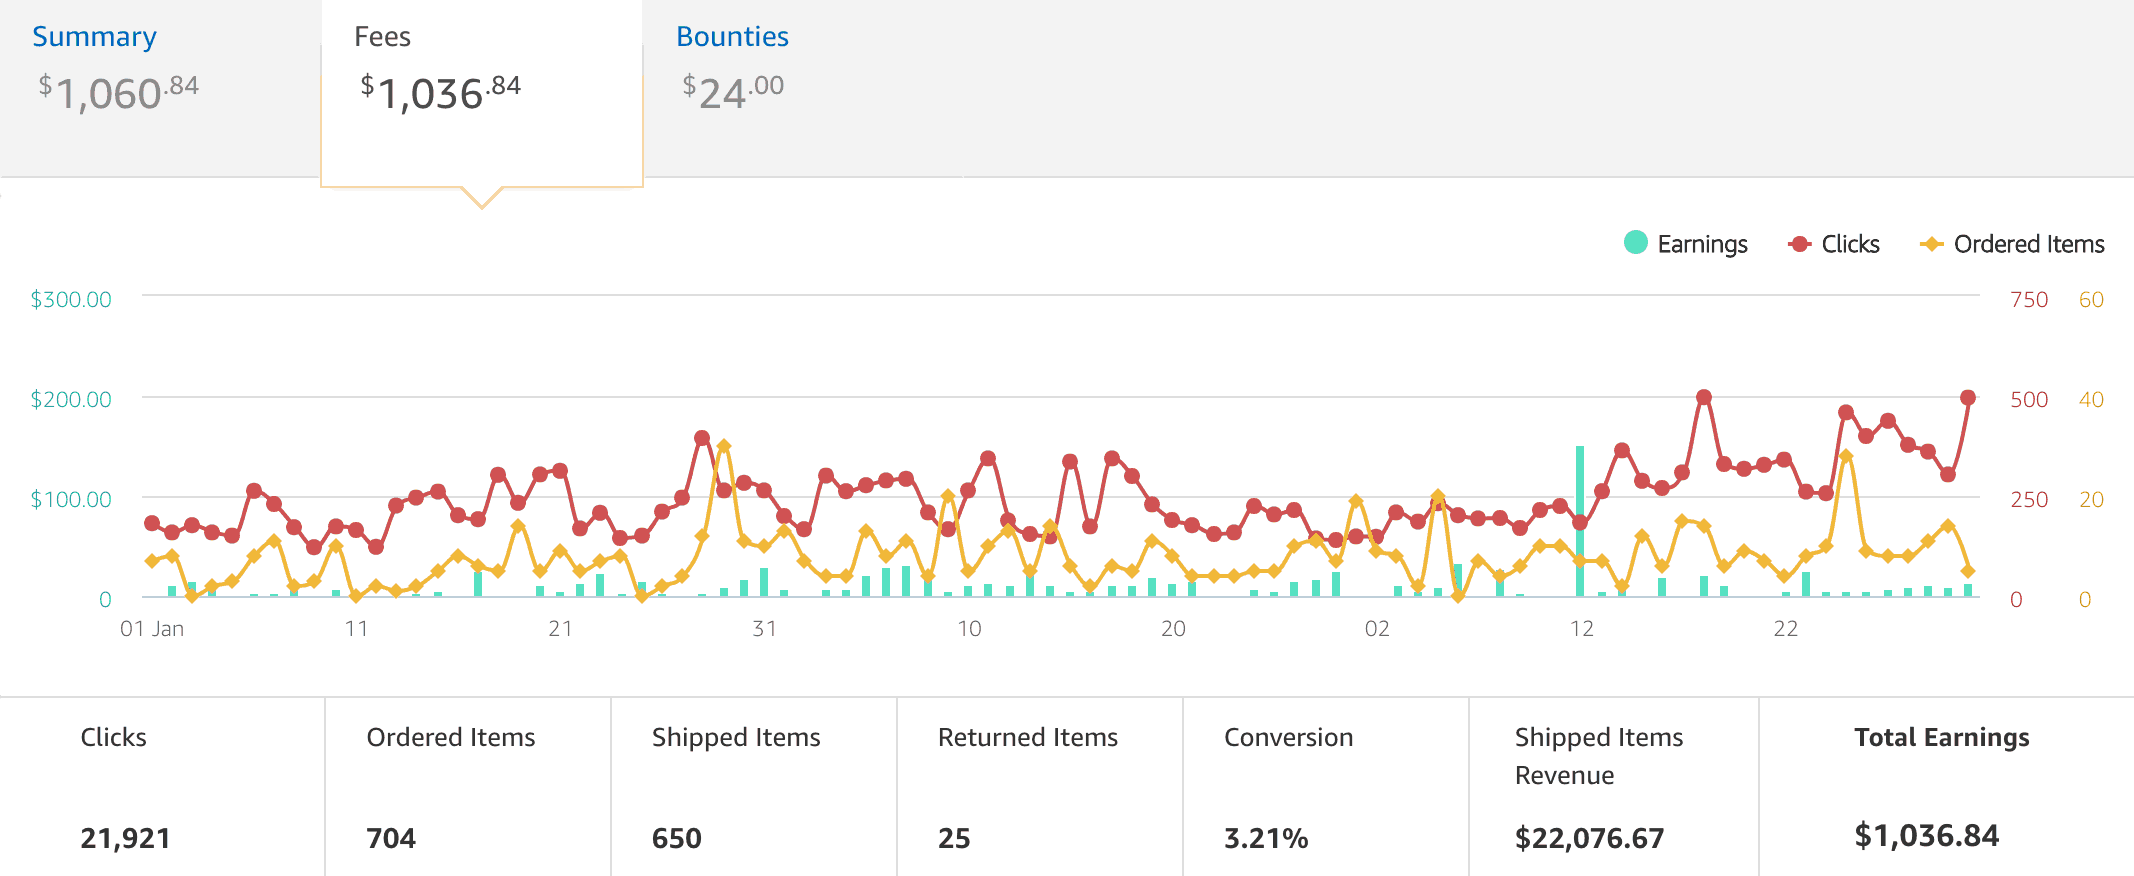
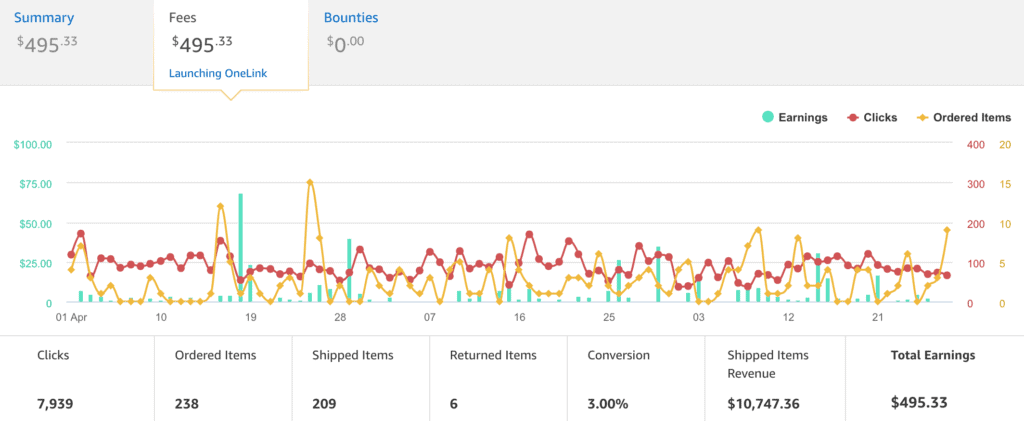
Last but not least, Amazon also brought in a decent amount of affiliate income. The majority of our Amazon affiliate income is generated by people who visit the following pages where we recommend gear we use and love:
Our Vlogging Gear
Our Packing List
Keep Us on the Road
5. Sponsored Content – $50,100 (Change from Q2 -$34,800)
As our channel grows, we continue getting more and more opportunities to include sponsorships in our videos. It seems like every day someone sends me an email asking us to review their product on our channel. We turn down the majority of these offers, but if the product/company meets our 3 criteria, then we entertain the idea of adding them as a sponsor:
- Can we get genuinely excited about the product/company?
- Is this something we think our viewers would be interested in knowing more about?
- Does the company value our platform, and are they willing to pay us enough money?
We keep a list of brands we’d love to work with, but we do not proactively reach out to companies to set up sponsorships. We’ve just learned that this usually doesn’t work out. In fact, 100% of the money we’ve made from working with brands this year has come from companies approaching us wanting to work together.
This month, we finally had the opportunity to work with a brand who has been at the top of our list for a very long time. We have been living out of our Away luggage for the last 2 years. We love these bags so much that we have been approached by other luggage brands who have offered to pay us, but we have turned them down because we wanted to continue traveling with our Away luggage.
So, when Away reached out to us earlier this quarter, we were super excited to finally have the opportunity to work with them. Together, we came up with the concept of incorporating their brand into a series of videos where we helped a loved one mark something off their bucket list, which lead to us bring Kara’s dad to Vietnam 🙂
Normally when we get approached by a brand, it’s because they want us to promote a product to our audience, but this quarter OnePlus reached out to us with a different idea. They gave us the opportunity to shoot part of a video for the launch of their new OnePlus 7T. It was a fun challenge to create a video completely different from the videos that we normally upload to YouTube. If you want to check it out, you can do so here.
These were the two big projects that lead to a big boost in our sponsored content revenue this quarter.
Total Q3 Income – $149,087.72 (Change from Q2 +$60,562.77)
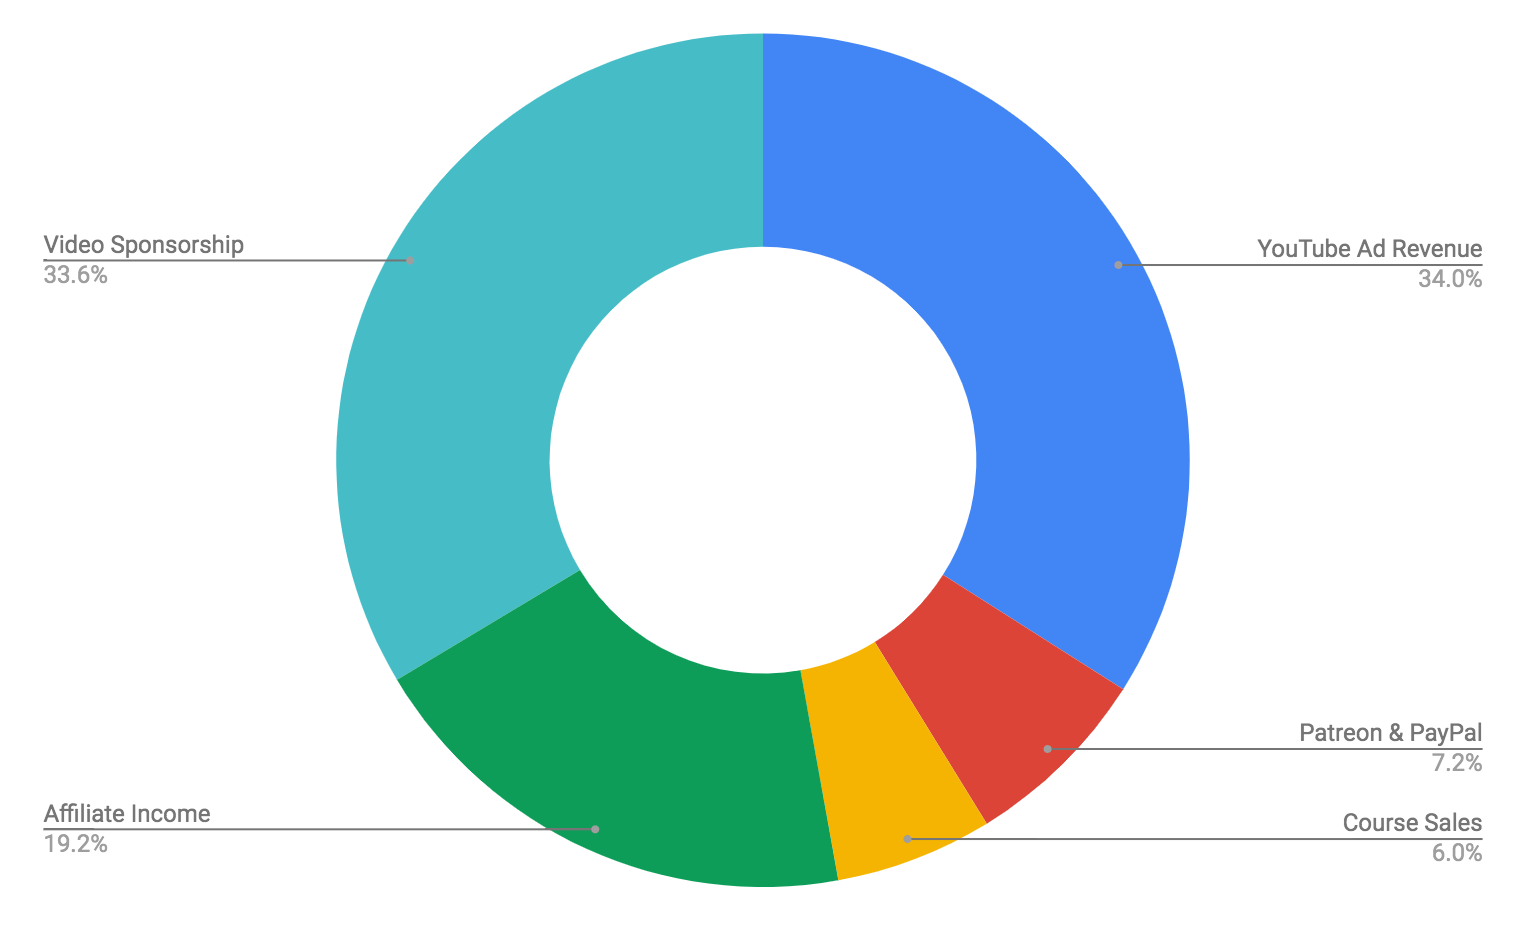
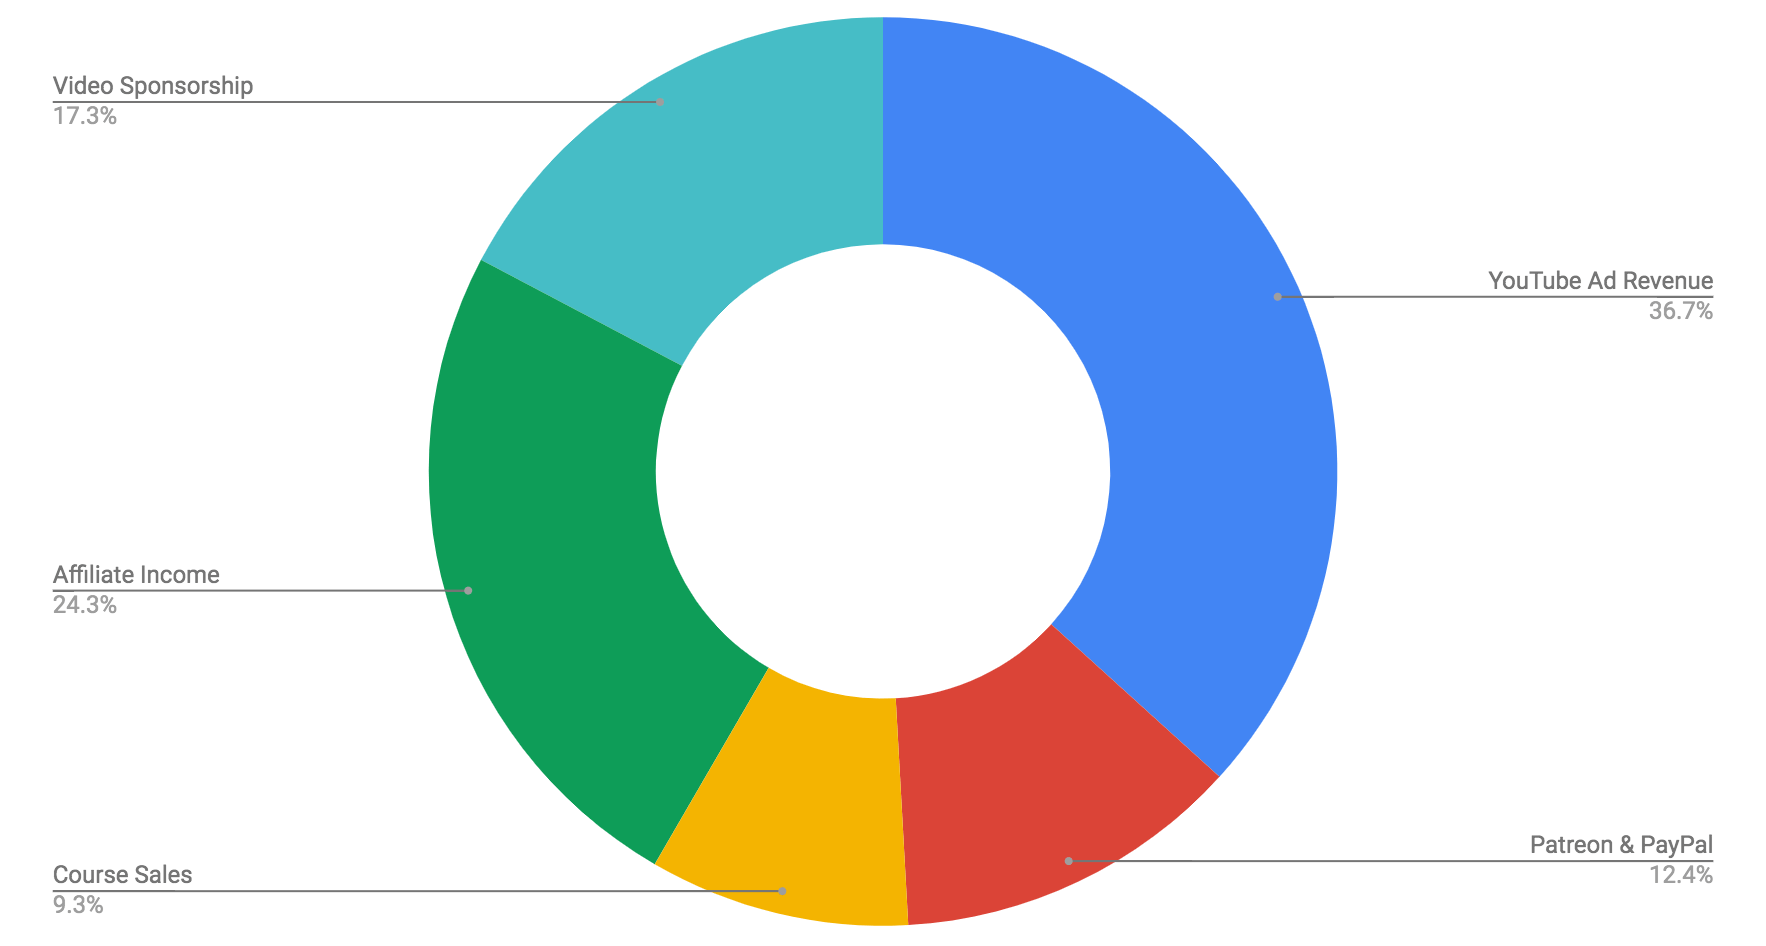
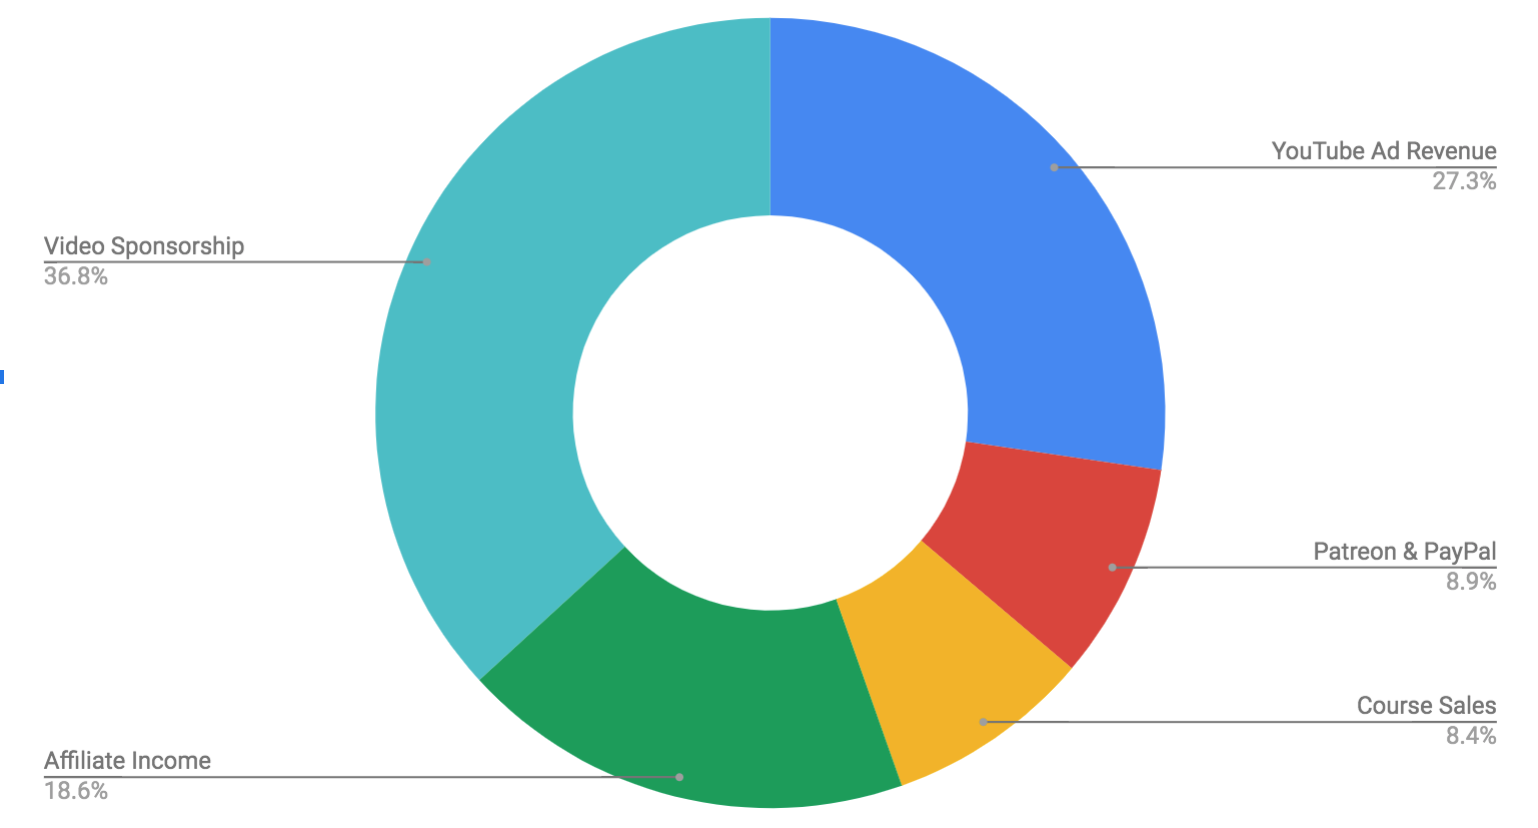
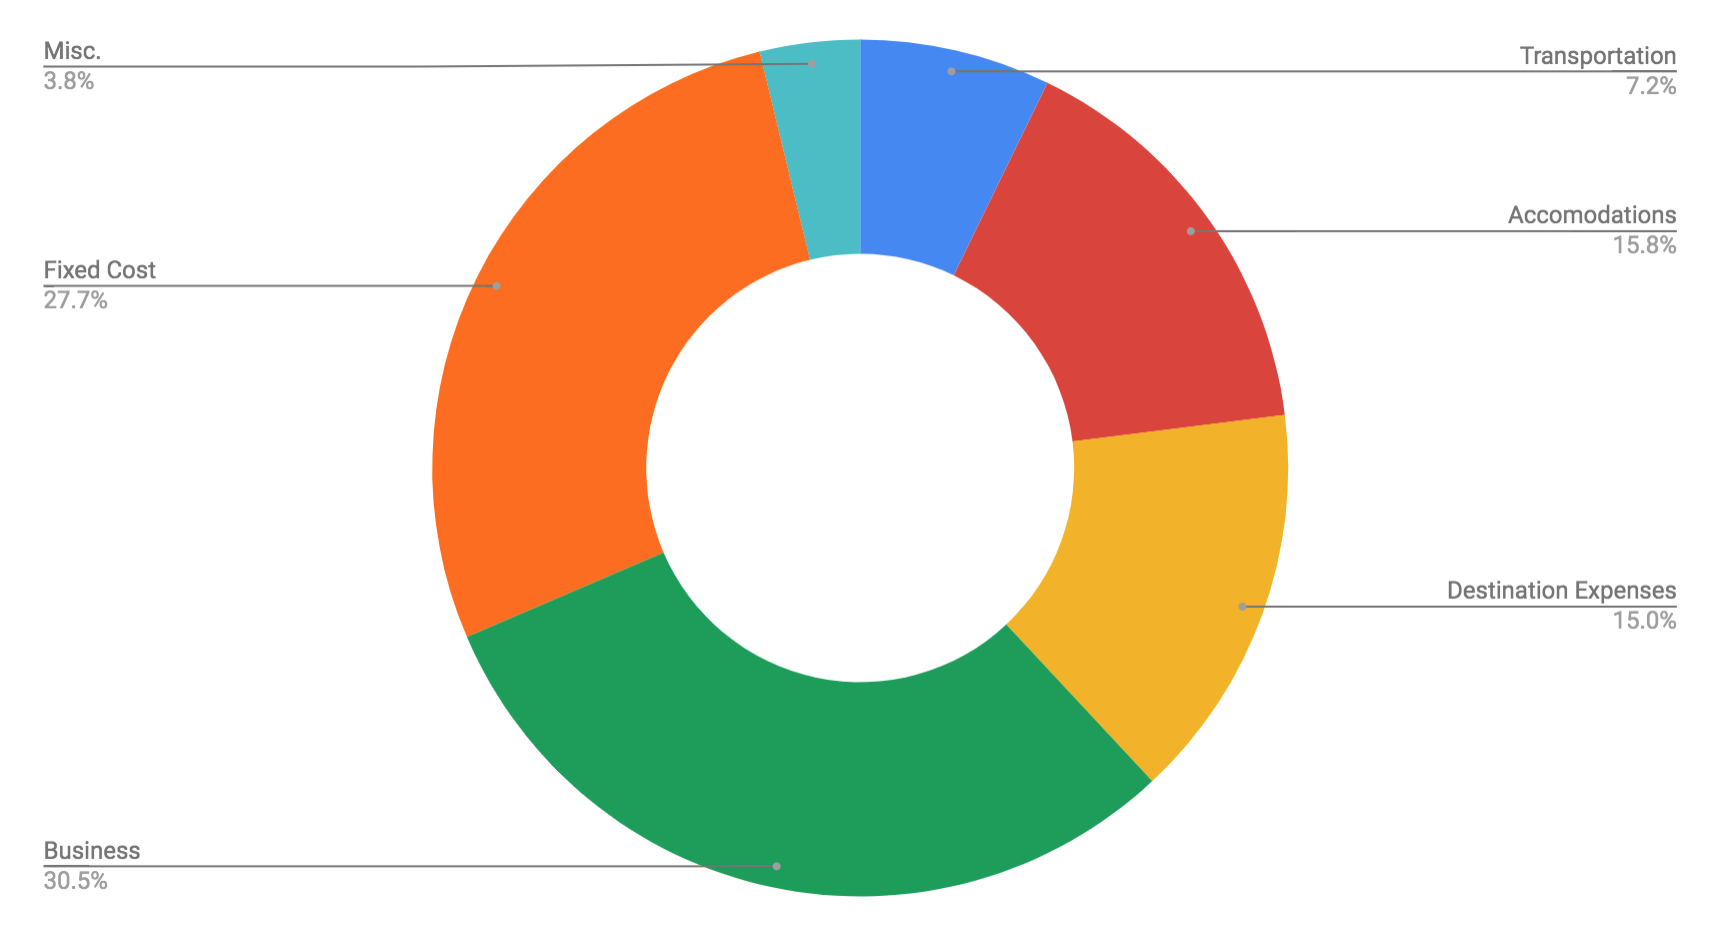
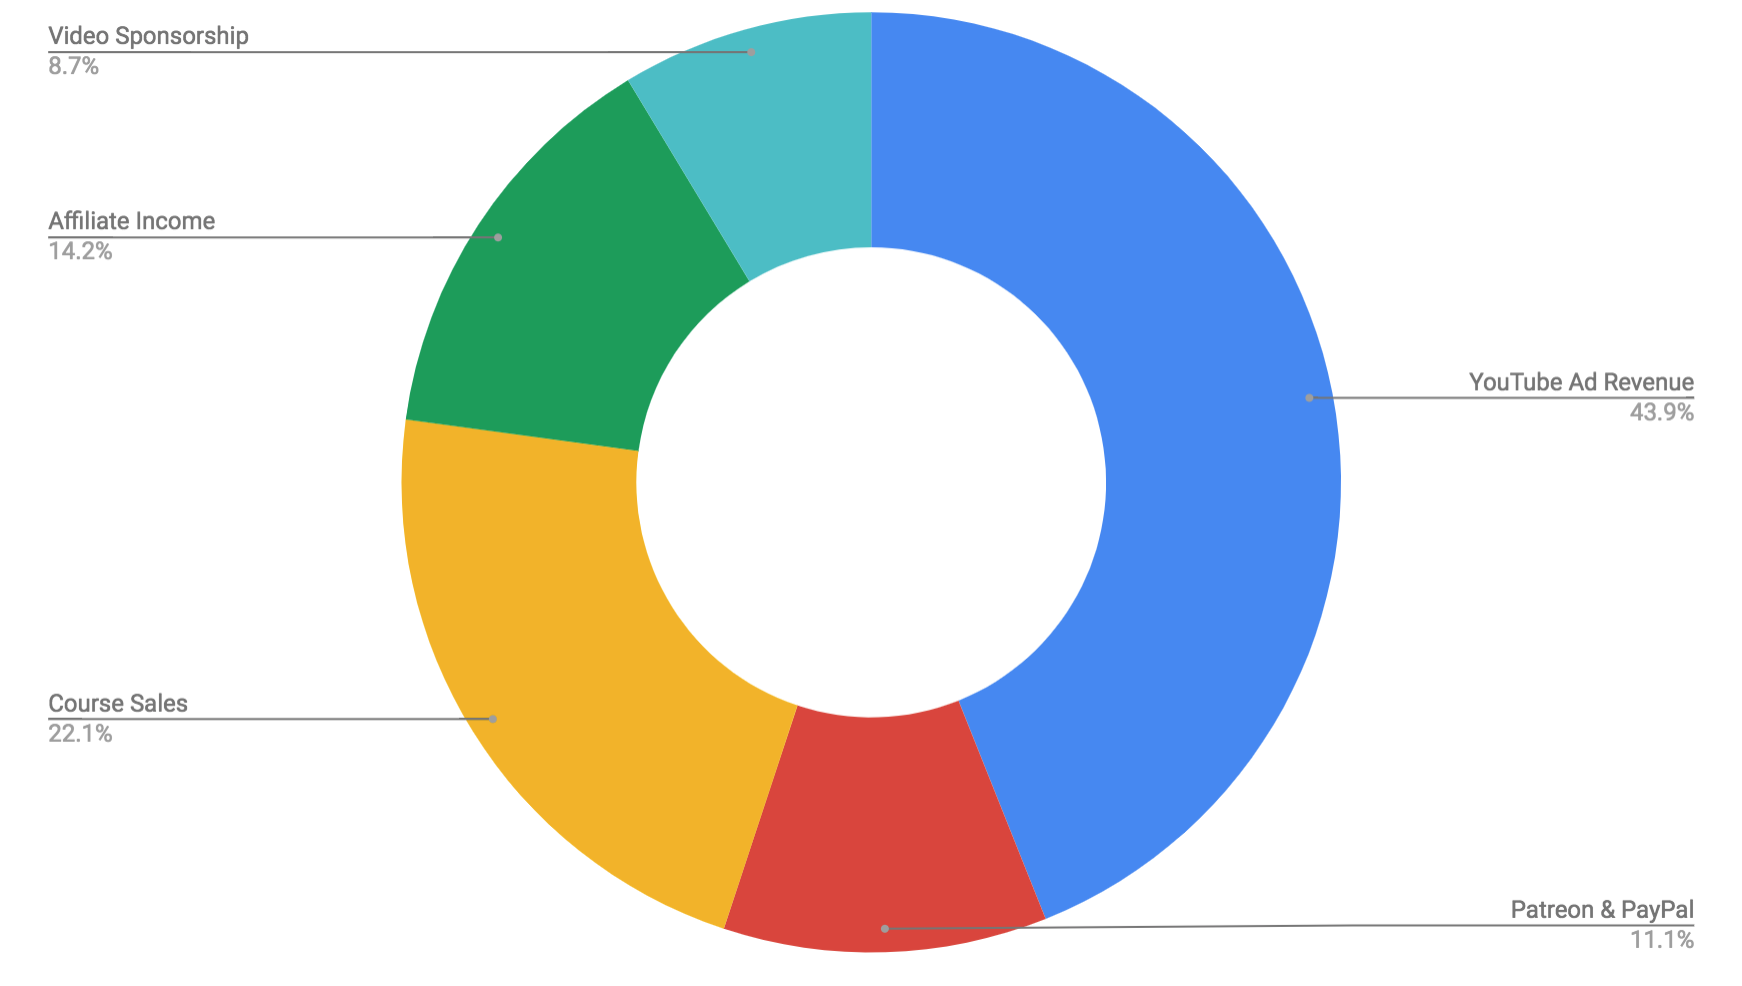
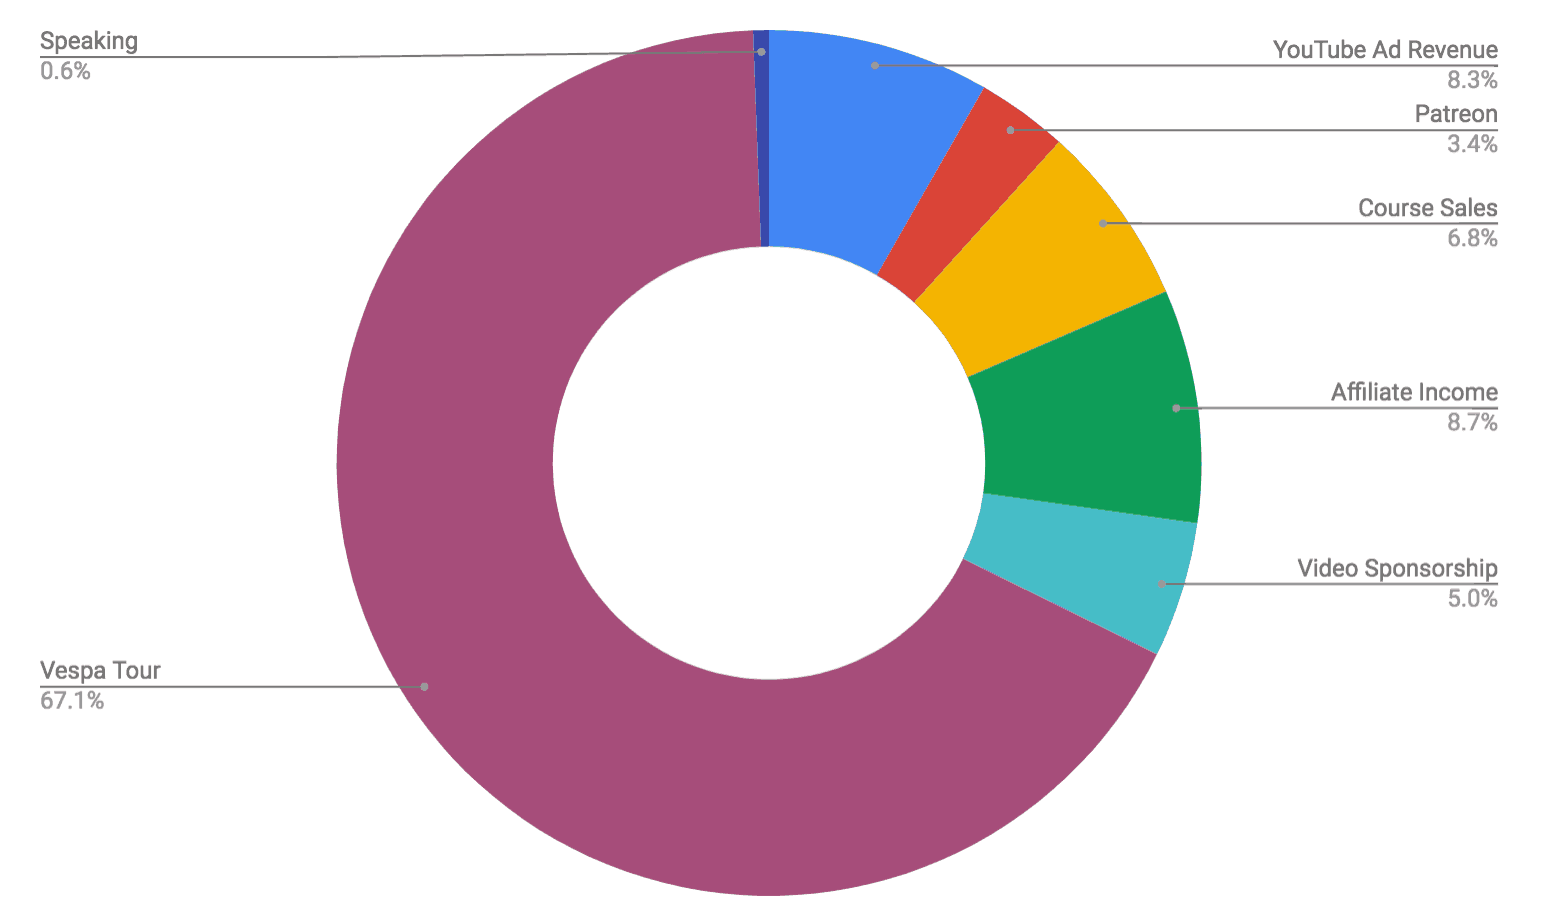
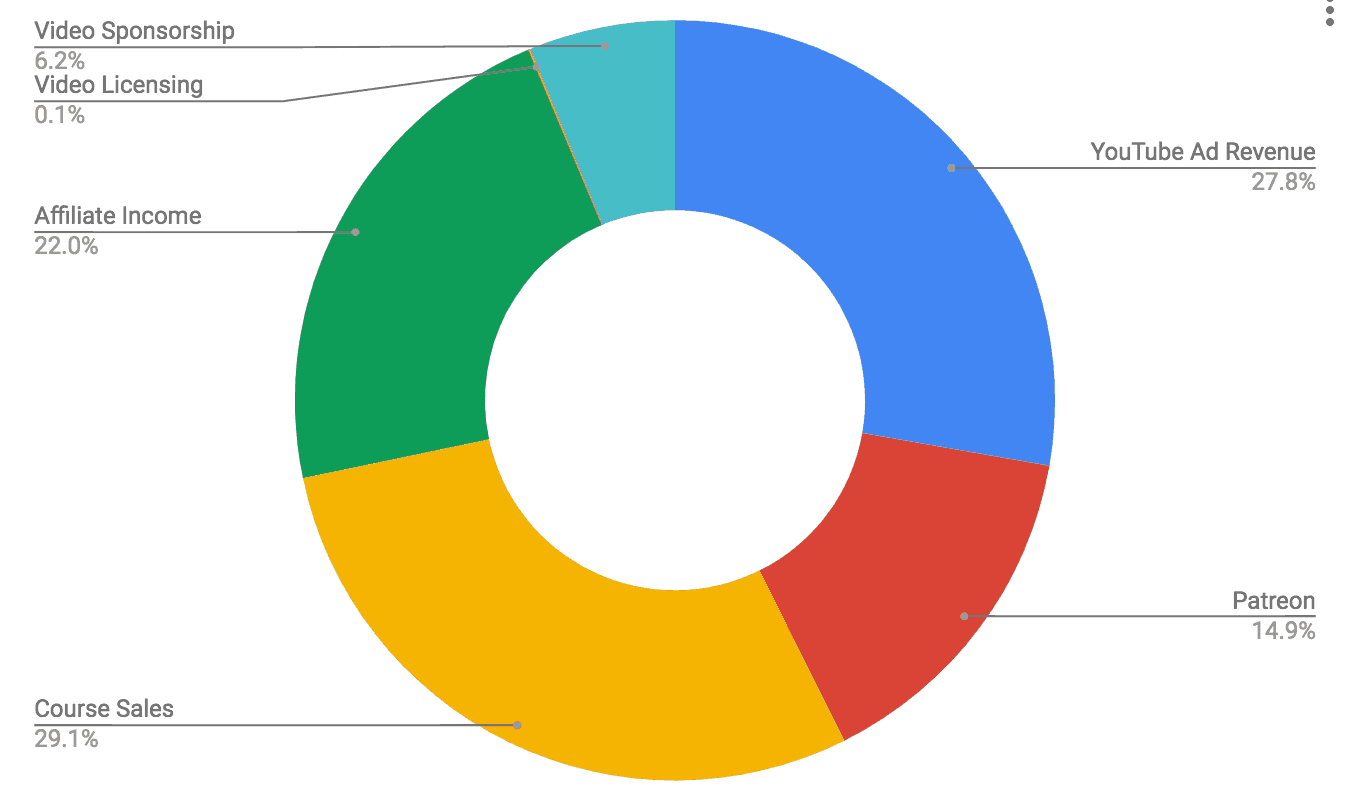
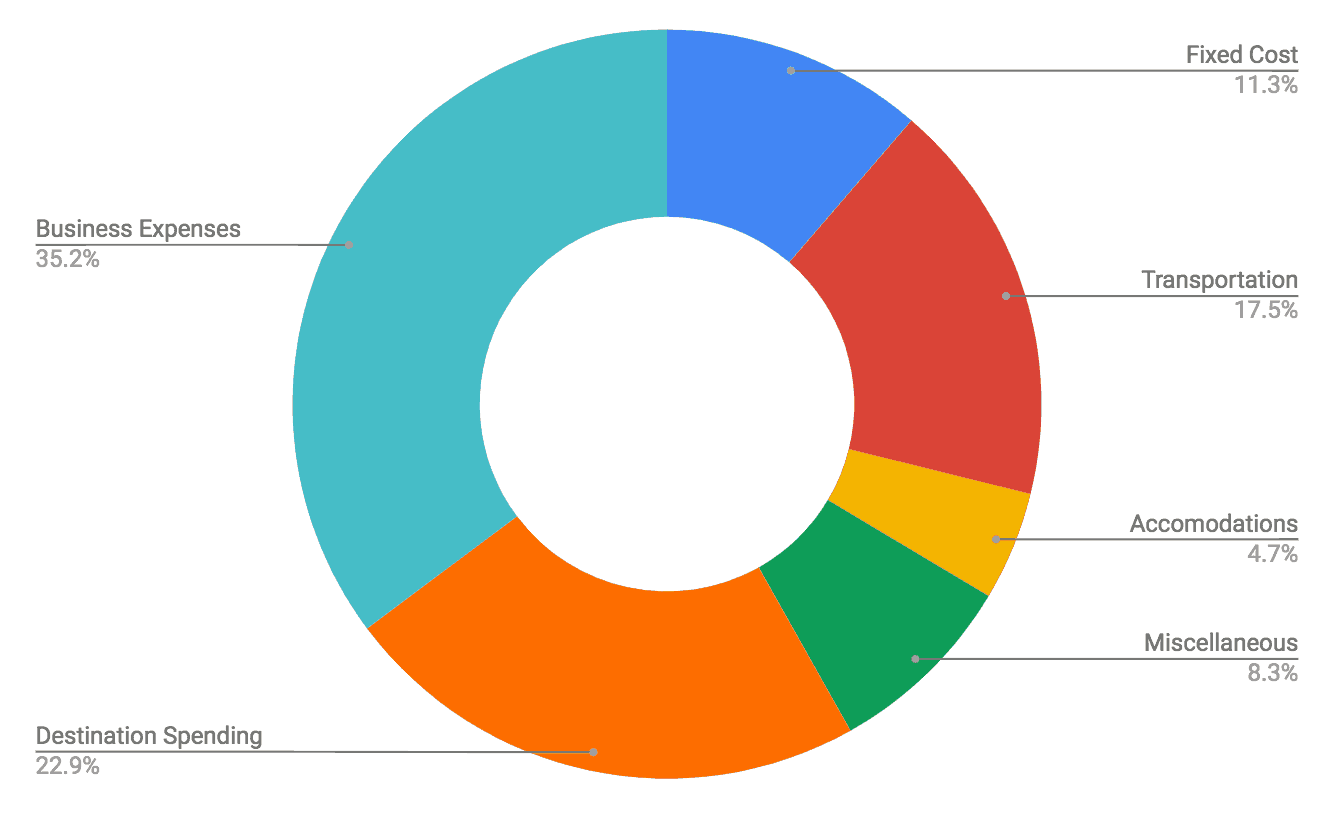
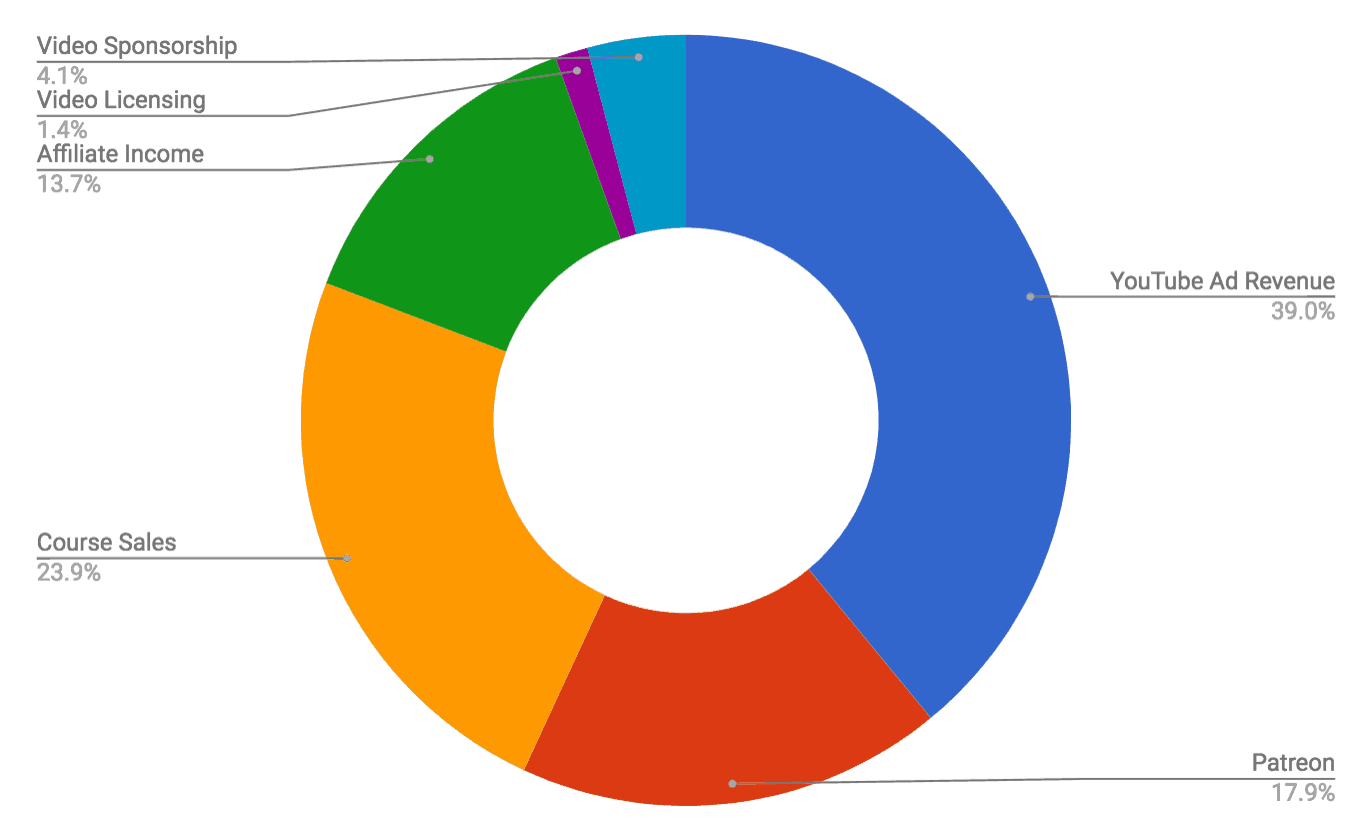
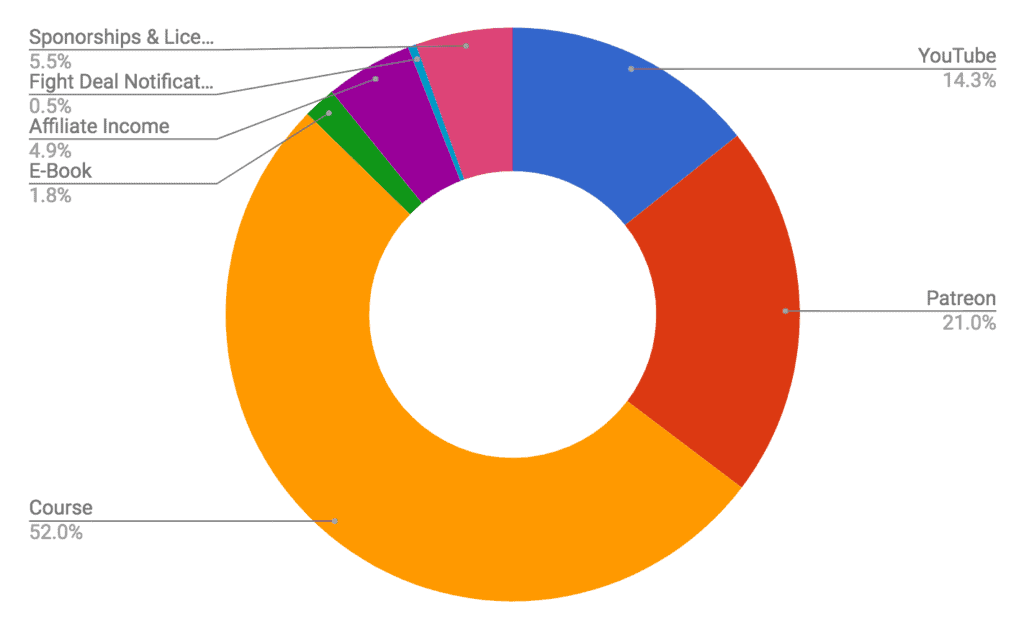
The pie chart above gives you a quick breakdown of how each revenue stream is contributing to our total income.
Expense Report
Transportation Expenses – $5,831.75
Normally we’ll travel really fast for a few months and get super behind on content before finally making ourselves take a long break to catch up. However, we want our videos and our real-life to be as close as possible as we reach our goal of visiting 100 countries. So, we’ve tried to do a better job of taking breaks between trips to edit and post.
We actually did a decent job at finding a balance this quarter (which is rare), and since we traveled slower than usual, we didn’t have to spend a ton on transportation. Especially if you exclude the three flights we bought to Vietnam to make the Away project a reality. They are included in this category because even though they were paying us to make a video, we still had to cover all of the travel costs.
| Origin | Destination | Transport | USD | Misc. |
|---|---|---|---|---|
| Total | $5,831.75 | |||
| Hanoi | Venice | Plane | $1251.08 | |
| Tutto Doppoi | Zurich | Train | $0 | CitizenM Project |
| Zurich | St. Moritz | Train | $0 | CitizenM Project |
| St. Moritz | Zermatt | Train | $594 | Glacier Express |
| Zermatt | Interlaken | Train | $83.37 | |
| Interlaken | Liechtenstein | Train | $95.27 | |
| Liechtenstien | Zurich | Train | $38.31 | |
| Zurich | Kiev | Plane | $550.66 | |
| Kiev | Lviv | Overnight Train | $107.13 | |
| Lviv | Barcelona | Plane | $716.80 | |
| Barcelona | Vietnam | Plane | $2,395.21 | Me, Kara, and Kevin |
Accommodation Expenses – $3,784.49
Thanks to Airbnb referral credits, good friends, and a few complimentary accommodations for work projects, our accommodation expenses averaged out to just over $1,200 per month. That’s not exactly cheap, but it’s also not bad considering we spent 2 weeks in Switzerland, and we booked really nice Airbnbs by local standards in Ukraine and Vietnam.
CLICK HERE to save $40+ on your first Airbnb
| Location | Accommodations | Nights | Cost | Misc. |
|---|---|---|---|---|
| $3,784.49 | ||||
| Hanoi | Hotel | 3 | $0 | Marriott Points |
| Hanoi | Airbnb | 23 | $0 | Redeemed Airbnb Referral Credits |
| Venice | Airbnb | 2 | $150 | |
| Tutto Doppio | B&G's | 19 | $0 | Thanks B&G |
| Zurich | Hotel | 3 | $453.16 | |
| St. Moritz | Airbnb | 3 | $0 | Redeemed Airbnb Referral Credits |
| Zermatt | Hotel | 3 | $451.99 | |
| Monte Rosa | Mountain Hut | 1 | $195.74 | |
| Interlaken | Airbnb | 2 | $0 | Redeemed Airbnb Referral Credits |
| Liechtenstein | Hotel | 2 | $287.03 | |
| Kiev | Airbnb | 11 | $255.29 | Redeemed Airbnb Referral Credits |
| Lviv | Airbnb | 9 | $412 | |
| Hanoi | Hotel | 4 | $489.28 | |
| Ha Long Bay | Cruise | 1 | $610 | |
| Ninh Binh | Hotel | 2 | $113 | |
| Hanoi | Hotel | 8 | $367 |
Destination Expenses – $4,672.30
This category is the money we spent while on the ground at each destination. This includes things like food, local transportation, and entertainment.
| Destination | Dates | Expenses |
|---|---|---|
| Total | $4,672.30 | |
| Hanoi | July 1 - 8 | $242.13 |
| Venice | July 9 -31 | $354.40 |
| Tutto Doppio | July 11 - 31 | $736.86 |
| Switzerland | July 31 - August 16 | $685.75 |
| Kiev | August 16 - 28 | $686.94 |
| Lviv | August 29 - Sept 8 | $685.42 |
| Barcelona | September 8 - 14 | $450.60 |
| Vietnam | September 14 - 30 | $830.28 |
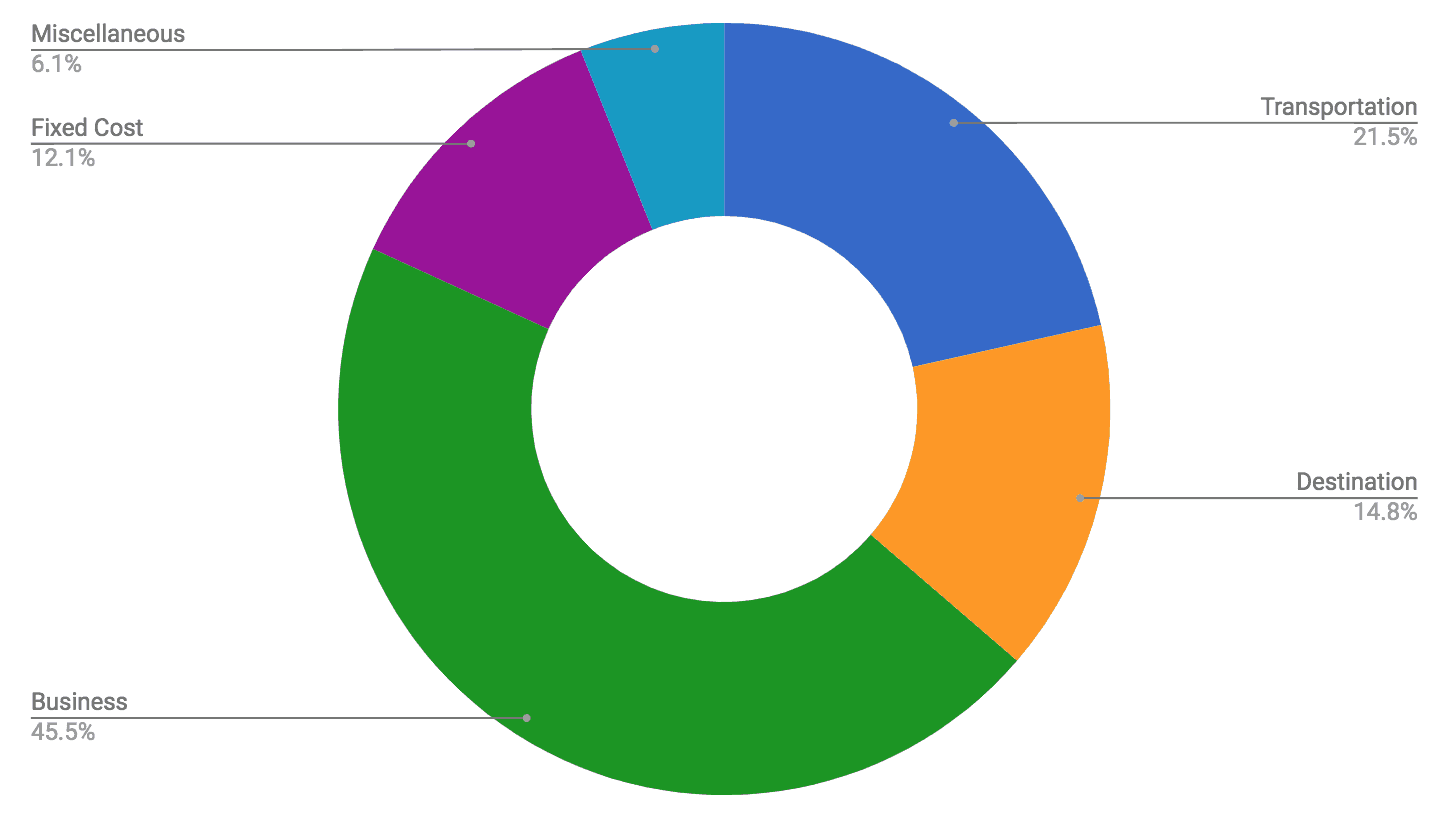
Business Expenses – $9,382.80
Each month we pay for several online subscriptions and other things to keep the vlog, blog, online courses, and email list running smoothly. We have also hired a few independent contractors to make sure we can keep things going strong as our channel and business continue to grow and evolve.
Travel Hacking Wingman -$3,880
If you’ve submitted a credit card consultation or signed up for my travel hacking course, you probably know Benji. He helps manage our travel hacking Facebook group for the students of my 30 Days to Becoming a Travel Hacker Course. He also helps me write travel hacking blog posts and give credit card consultations. I tried to do this alone for a long time, but I realized I needed help to ensure that we could help as many people as possible to travel cheaper using my travel hacking strategies. So, I’m super thankful I’ve found a fellow travel hacker I trust to help me with the mission.
Video Editor – $1,800
We currently work with one part-time editor who helps rough-cut almost every video. The original goal of hiring an editor was to help save Kara time in the editing process. At this point, that’s still debatable, but it’s definitely increased the quality of our videos which we’re really happy about!
Assistant – $570
This is our first full quarter with a part-time assistant, she only works a few hours per week (as you can tell from the pay), but she has really helped free us from some of the repetitive tasks that were taking up too much of our time.
Convert Kit – $0 (we paid upfront for the year)
The great email platform that we use to send emails to our list of 50,000+ people. It’s great!
Teachable – $297
The platform where we host our courses – 30 Days to Becoming a Travel Hacker and Kara’s Behind the Scenes Guide to Editing a Vlog.
Premiere Pro (Adobe) – $263.64
The program Kara uses to edit our videos.
Google Service – $62.99
This is the money we pay Google for our email address every month so that we can look semi-professional.
Touchnote Postcard – $719.80
This is the service we’re using to send postcards to our patrons!
Epidemic Sound – $45
This is where we get all of our royalty free music for our YouTube videos!
TubeBuddy – $57
This service allows us to bulk edit the cards and end screens across all of our videos on YouTube. Basically, we pay $19 to avoid spending hours of our lives monotonously changing small details on our channel.
Godaddy – $446.37
This is the service we use to pay for our website, hosting, and SSL certificates. Plus, all of the other domains I buy when I think of a good business idea 😉
Gleam.io – $0
This is the service we used to host our giveaways.
Motion Array – $87
I could have sworn we unsubscribed from this service…
VideoBlocks – $199
This was a service we used for stock footage to help us tell a better story in one of our videos. We went ahead and paid for a year upfront to get a discount.
OptinMonster – $0 (we paid upfront for the year)
If you’ve been to our website, you may recognize we have a few popups on different pages. This is the service we’re using to generate more email subscribers.
Affiliate payout – $450
We have an affiliate program for our online courses. This is the commission we paid out to affiliates who helped us make sales.
New Gear – $593
We purchased several miscellaneous pieces of this gear this quarter, but nothing noteworthy. Just small things we needed to keep things running smoothly.
Fixed Costs – $797.77
T-Mobile Phone Plan – $279.52
Google Fi – $296.49
Kara stuck with the T-Mobile Unlimited International plan because she can’t give up her iPhone. However, I decided to switch to Google Fi on my android because it’s a lot faster than T-Mobile’s international service. Having separate carriers slightly increases our overall phone bill, but both of us are happy with our current setup.
Health Insurance – $221.76
We switched to a new international health insurance plan this year: it’s called Safety Wing. It’s cheaper, but we haven’t actually had to use it, so I can’t tell you whether or not we recommend it.
Miscellaneous – $494.75
This category is made up of expenses that didn’t fit into any of the categories above. Some little things like Spotify and Netflix, and a few bigger things like credit card annual fees.
Total Q3 Expenses – $26,896.95
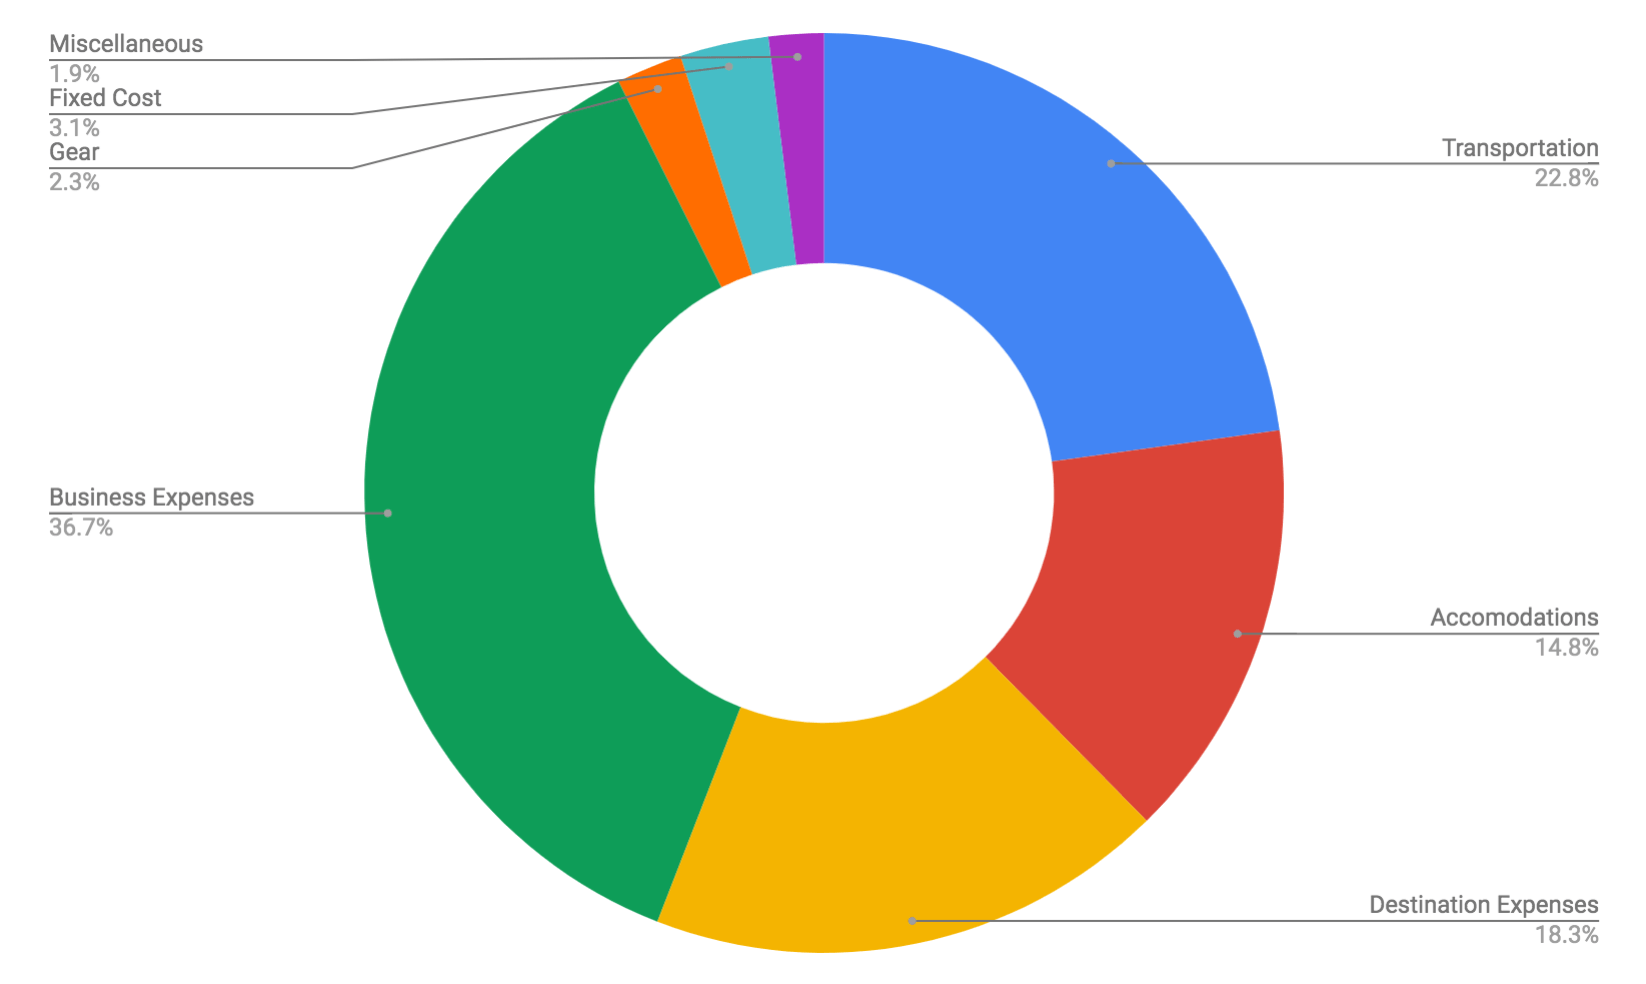
Summary
| Total Profit | $123,530.77 | |
|---|---|---|
| Income | ||
| YouTube Ad Revenue | $50,707.67 | |
| Patreon | $10,748.52 | |
| Courses | $8,889.00 | |
| Affiliate Income | $28,642.53 | |
| Video Sponsorship | $50,100.00 | |
| Total Income | $149,087.72 | |
| Expenses | ||
| Transportation | -$5,831.75 |
|
| Accommodations | -$3,784.49 | |
| Destination Expenses | -$4,672.39 | |
| Business Expenses | -$9,382.80 | |
| New Gear | -$593 |
|
| Fixed Cost | -$797.77 |
|
| Miscellaneous | -$494.75 | |
| Total Expenses | -$26,896.95 |
That’s a wrap for our Quarter 3 income and expense report. Thank you for all of your support. We couldn’t do it without you. I’d love to hear what you think about this report in the comments below!
